Session Analysis
Aggregate AI invocation data at the session level. View the complete context, Token consumption, and Agent collaboration topology for all Traces within a single session, helping you understand the overall behavior of multi-turn conversations.
Core Capabilities
- Session Overview: View summary metrics for all sessions — including total Token consumption, Trace count, and average duration — to quickly identify anomalous sessions.
- In-session Trace List: Inside a session detail page, view each invocation in chronological order with Input preview, response time, Token breakdown, and LLM/Tool call counts.
- Trace Waterfall Chart: Expand a single Trace to see a Gantt-style chart of each Span's latency hierarchy, color-coded by type: Agent, Chain, LLM, and Task.
- Agent Collaboration Topology: Visualize each Agent invocation round as a node graph showing latency, Token consumption, and call count per node — making the Agent execution structure immediately clear.
Use Cases
- Analyzing Multi-turn Token Cost: A user session runs for 3 hours. Enter the session detail to review Token consumption per Trace across 6 calls, and pinpoint the round with the highest Token usage.
- Root-causing a Slow Conversation Turn: Expand the slowest Trace and use the waterfall chart to identify that the
invoke → chain LangGraph → llm ChatOpenAIpath accounts for over 1 minute of latency. - Understanding Agent Execution Structure: Review the Agent Collaboration Topology to see the latency and call count for a given invoke node, and confirm whether the Agent routed as expected in that round.
Feature Guide
Session List
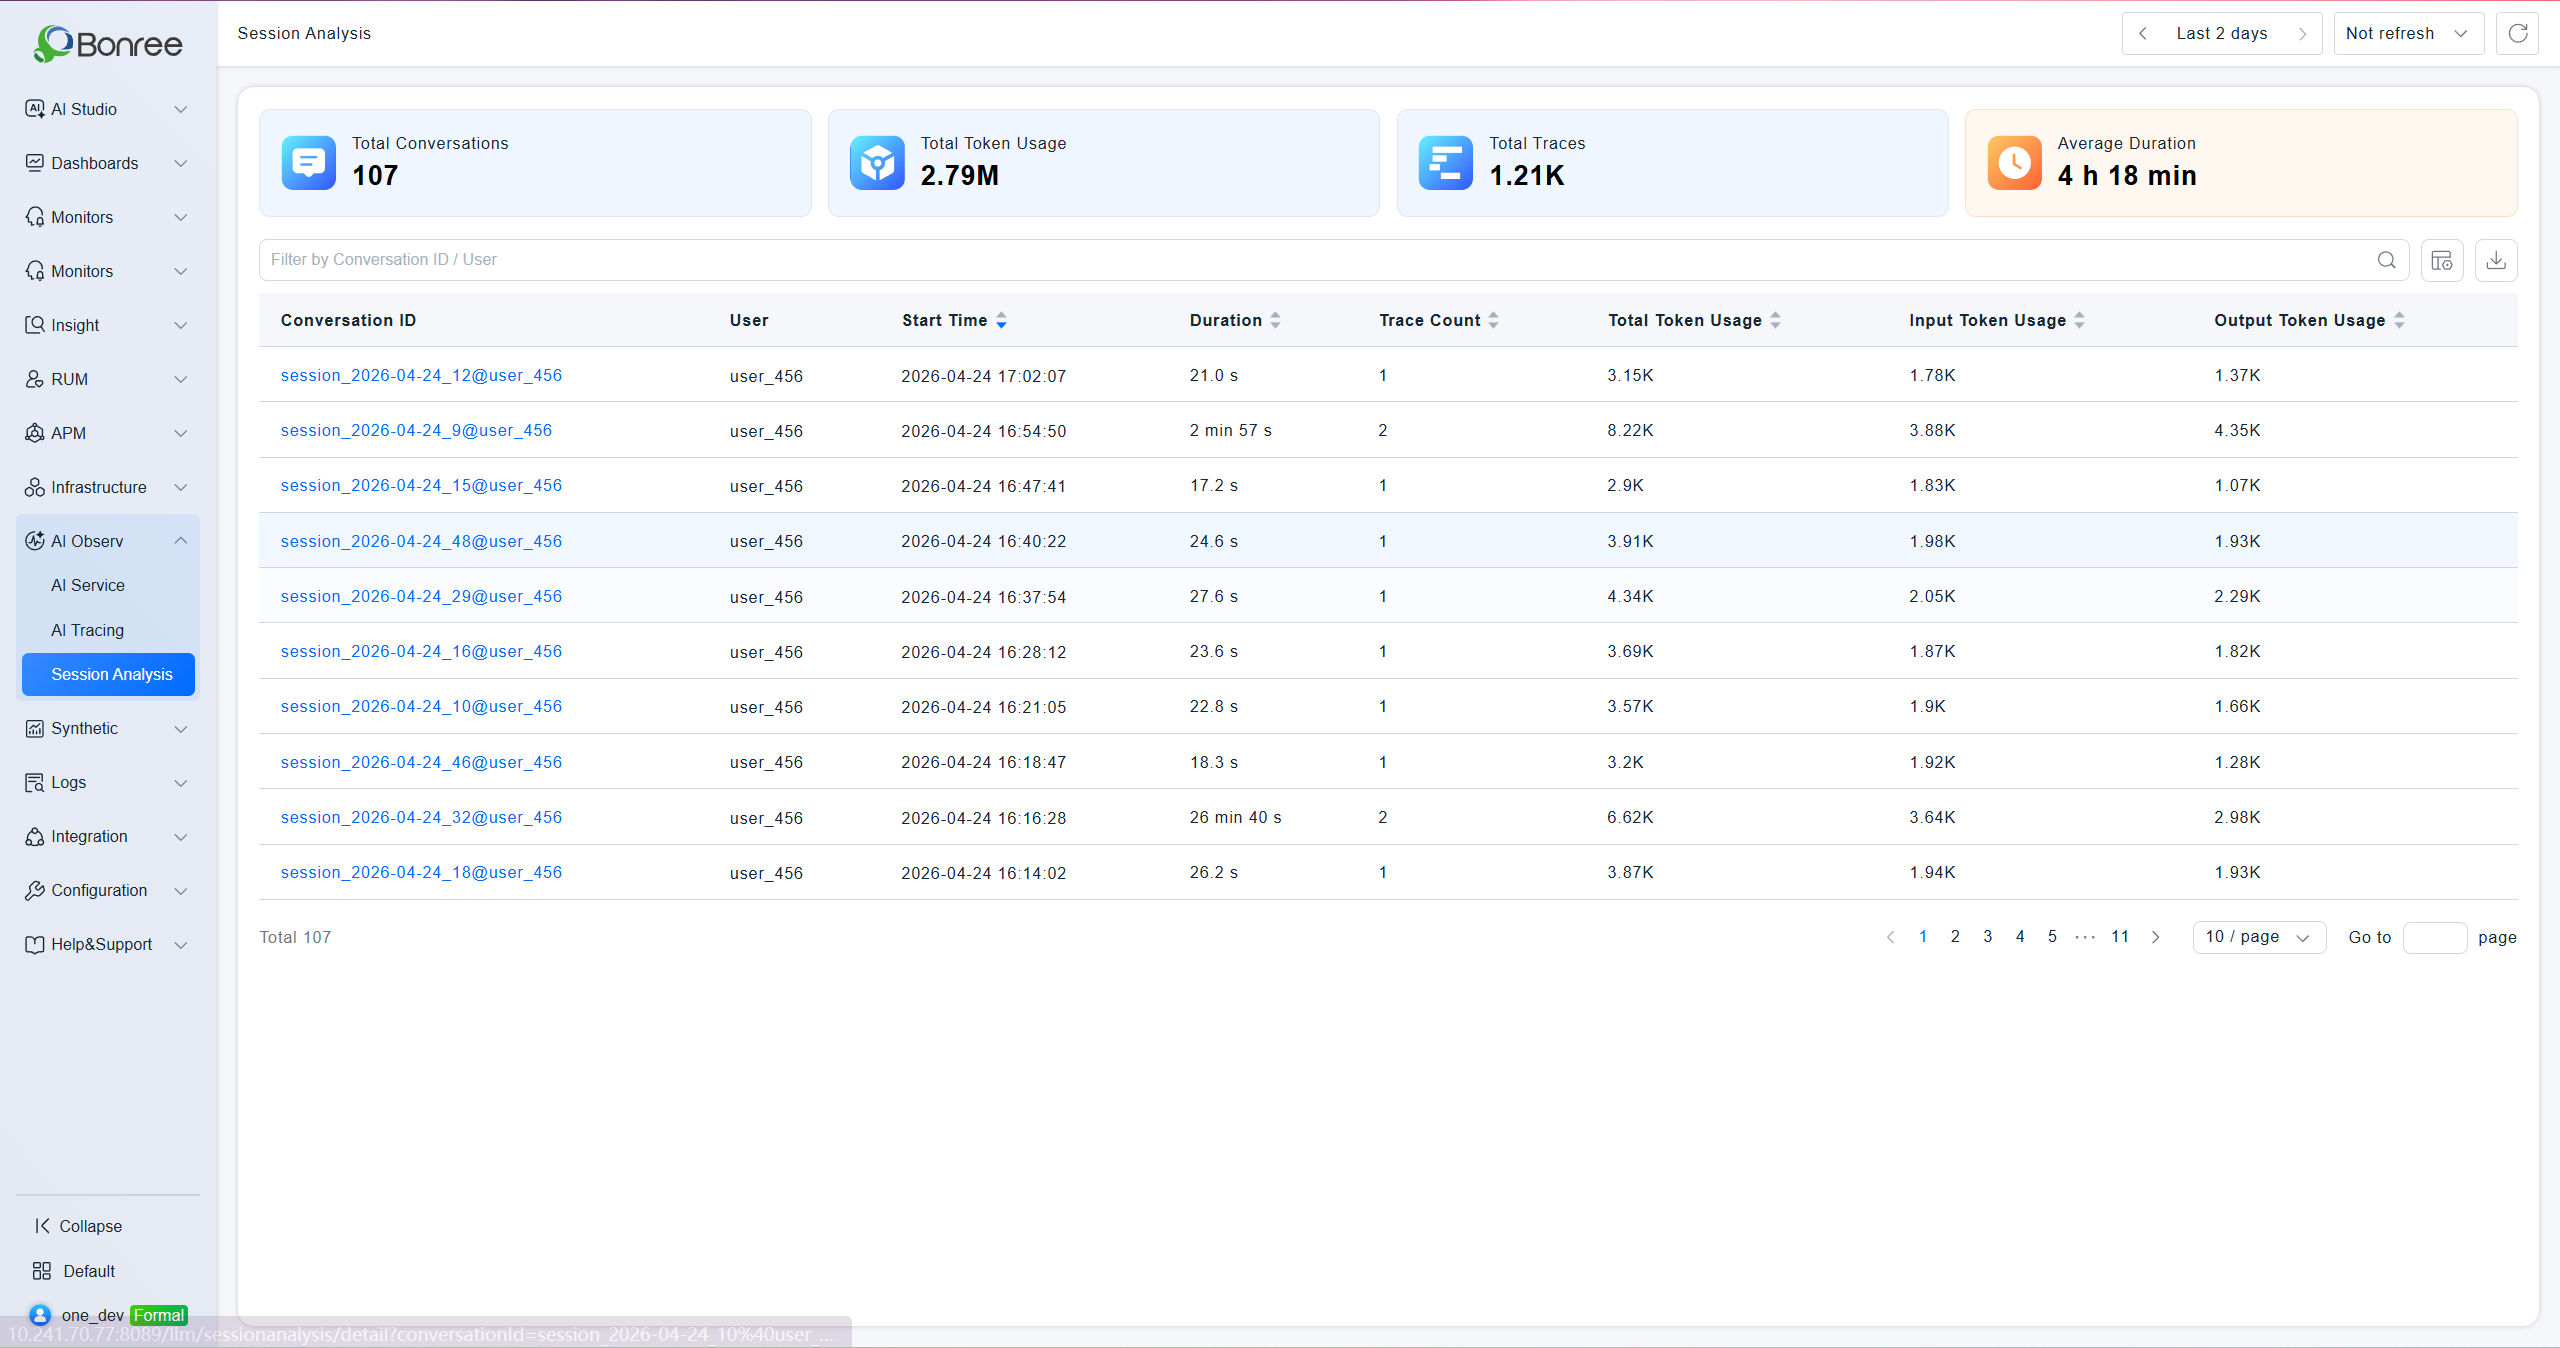
The top of the page shows four summary metrics for the current time range: total session count, total Token consumption, total Trace count, and average session duration.
The list displays each session's session ID, user, start time, Trace count, total Token consumption, Input Token consumption, duration, and Output Token consumption. Filter by session ID or user. Supports column customization and data export. Click a session ID to open the session detail page.
Session Detail — Header Bar
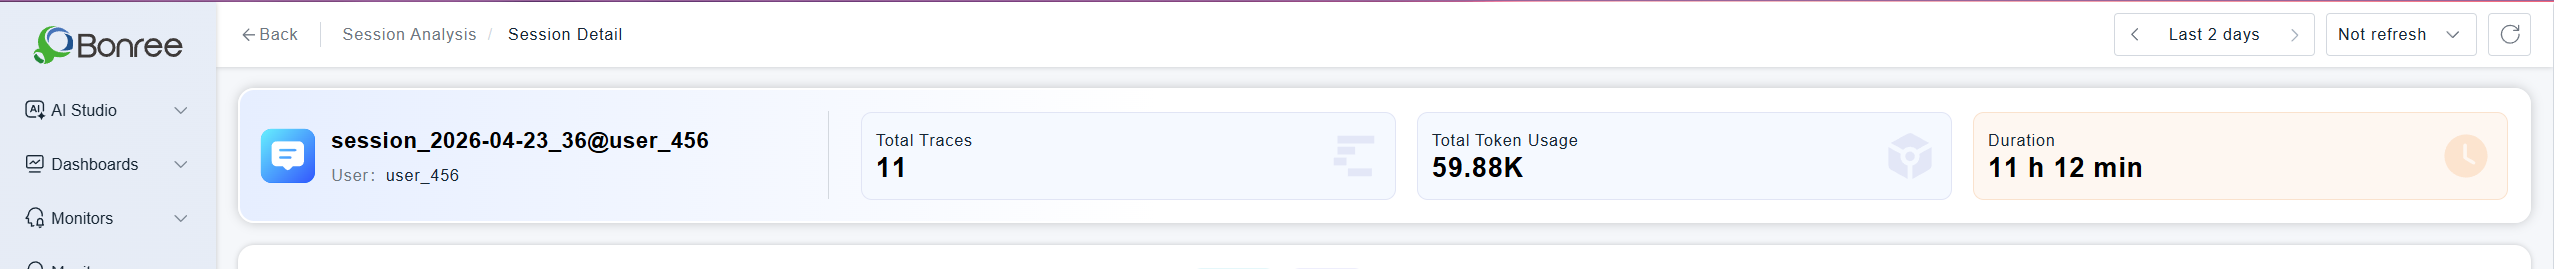
The top of the detail page shows the session ID, user, total Trace count, total Token consumption, and session duration.
Session Detail — Trace List
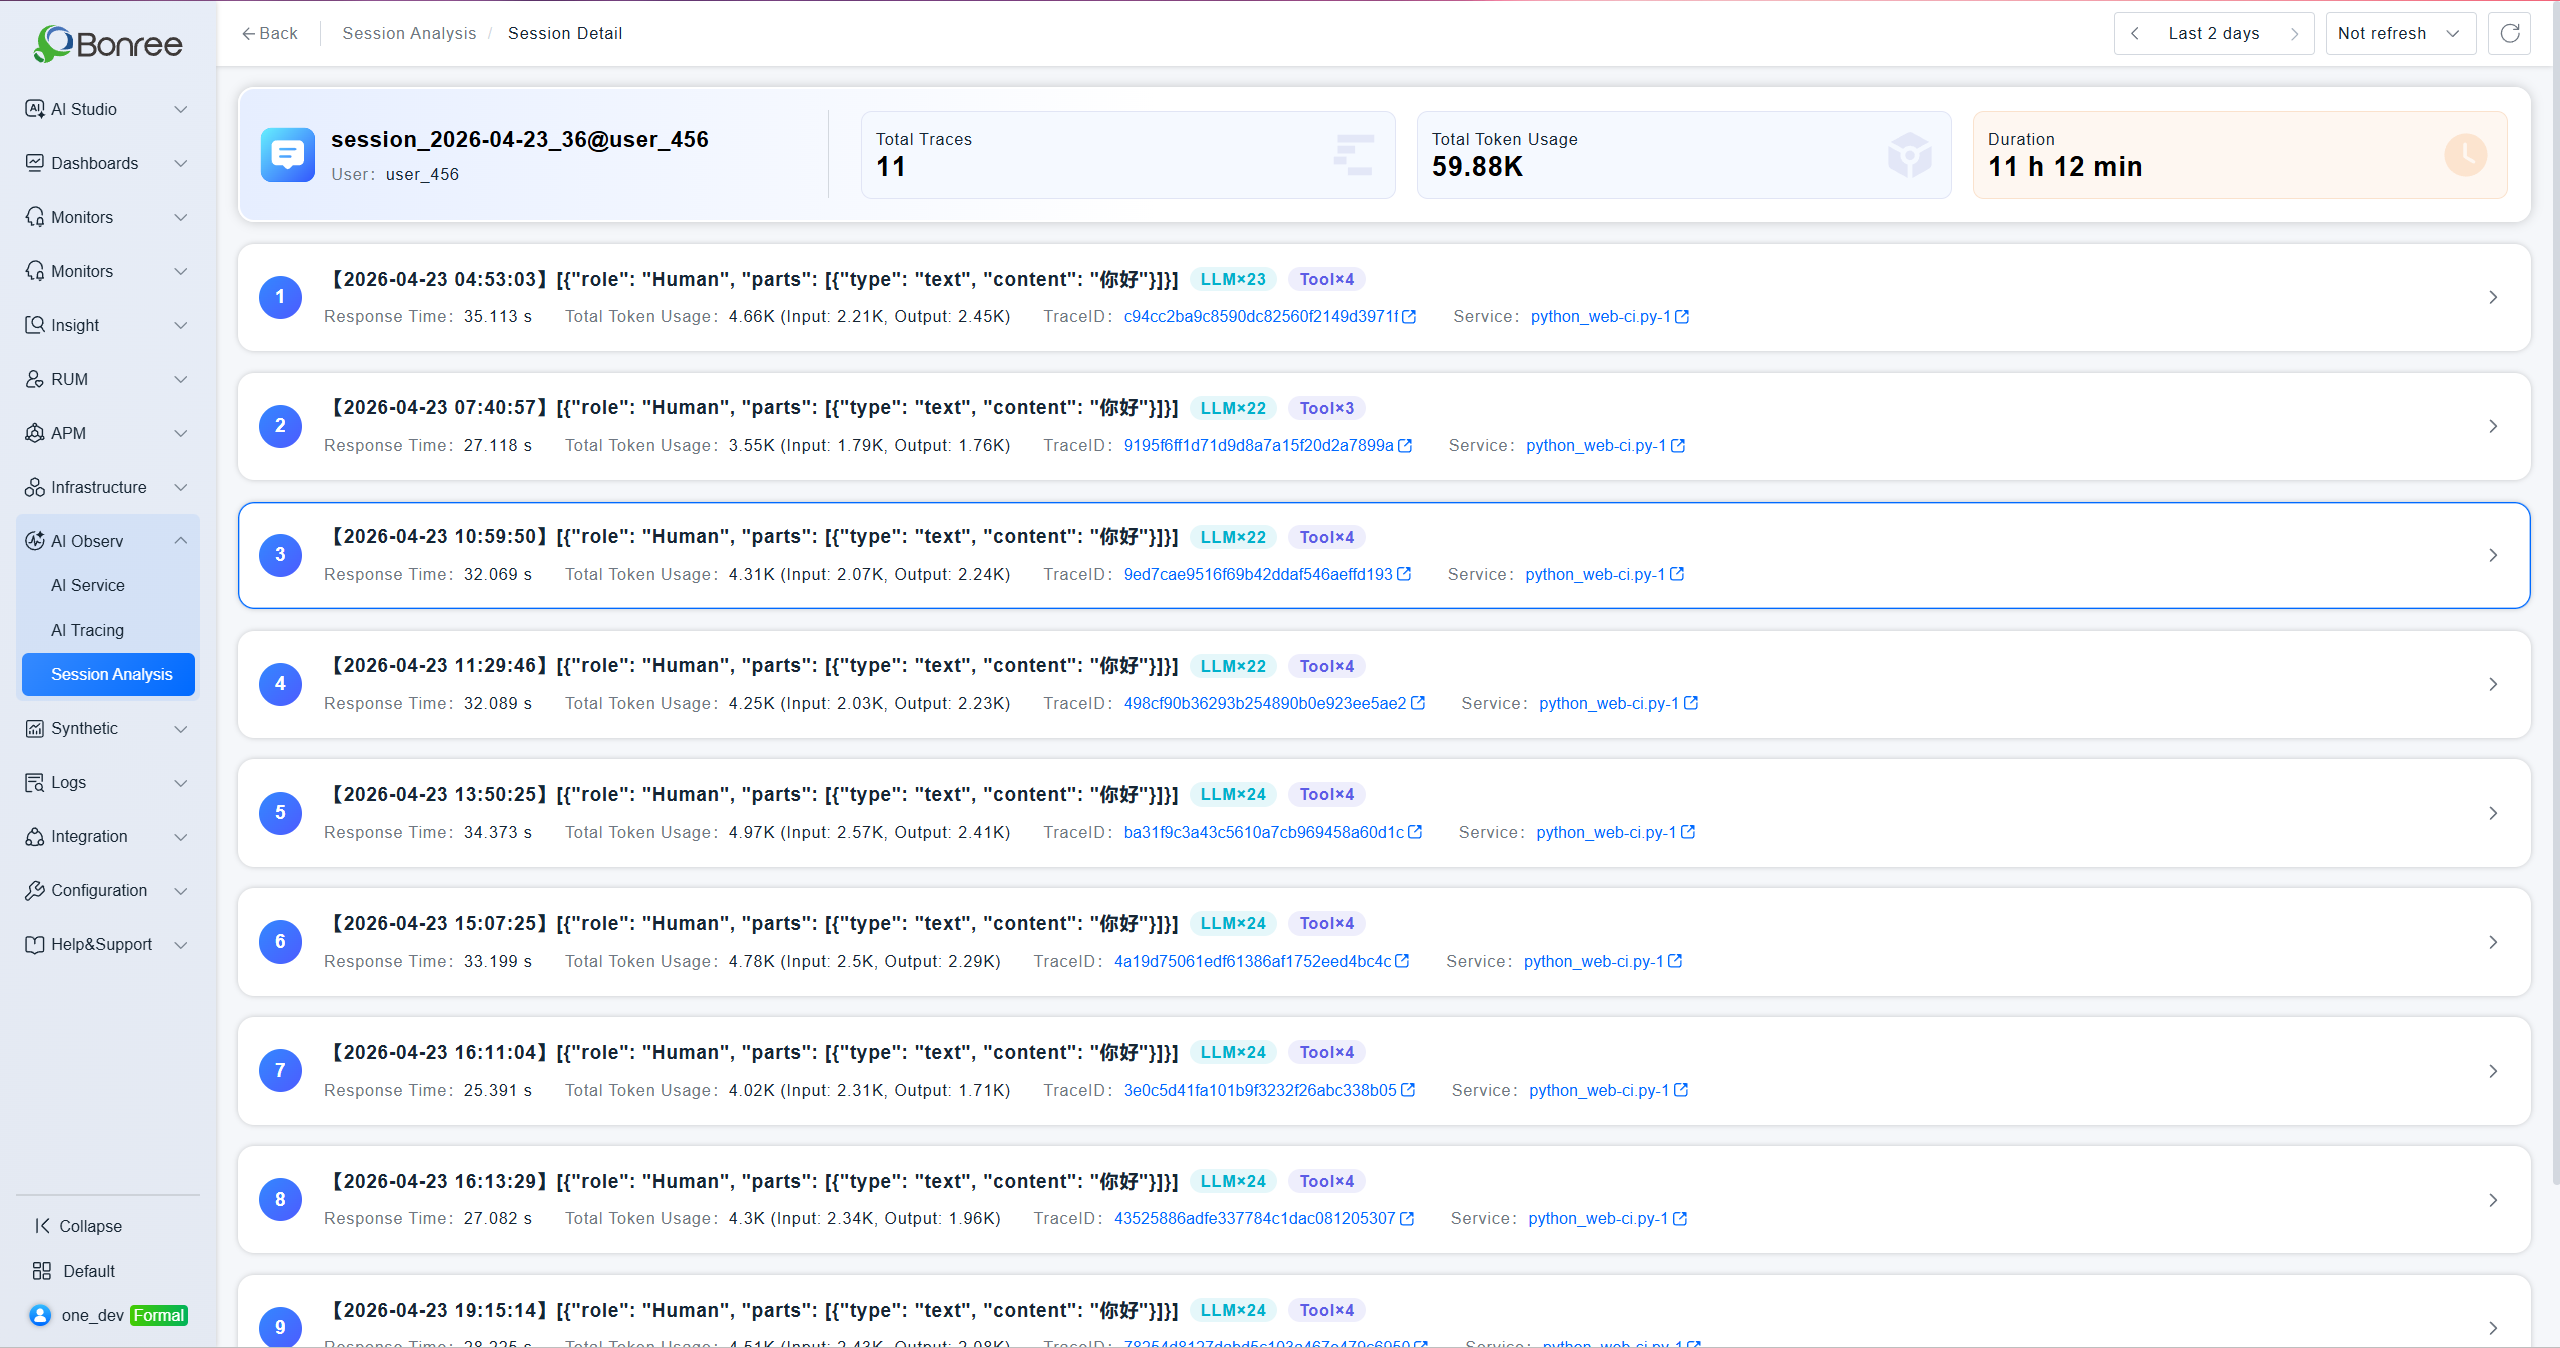
Displays each Trace within the session in sequence. Each record shows:
- Timestamp and Input content preview (System Prompt summary)
- Response time, total Token consumption (with Input/Output breakdown)
- Trace ID (clickable, navigates to full call chain detail)
- Application name (clickable, navigates to application detail)
- LLM call count and Tool call count badges
Trace Waterfall Chart
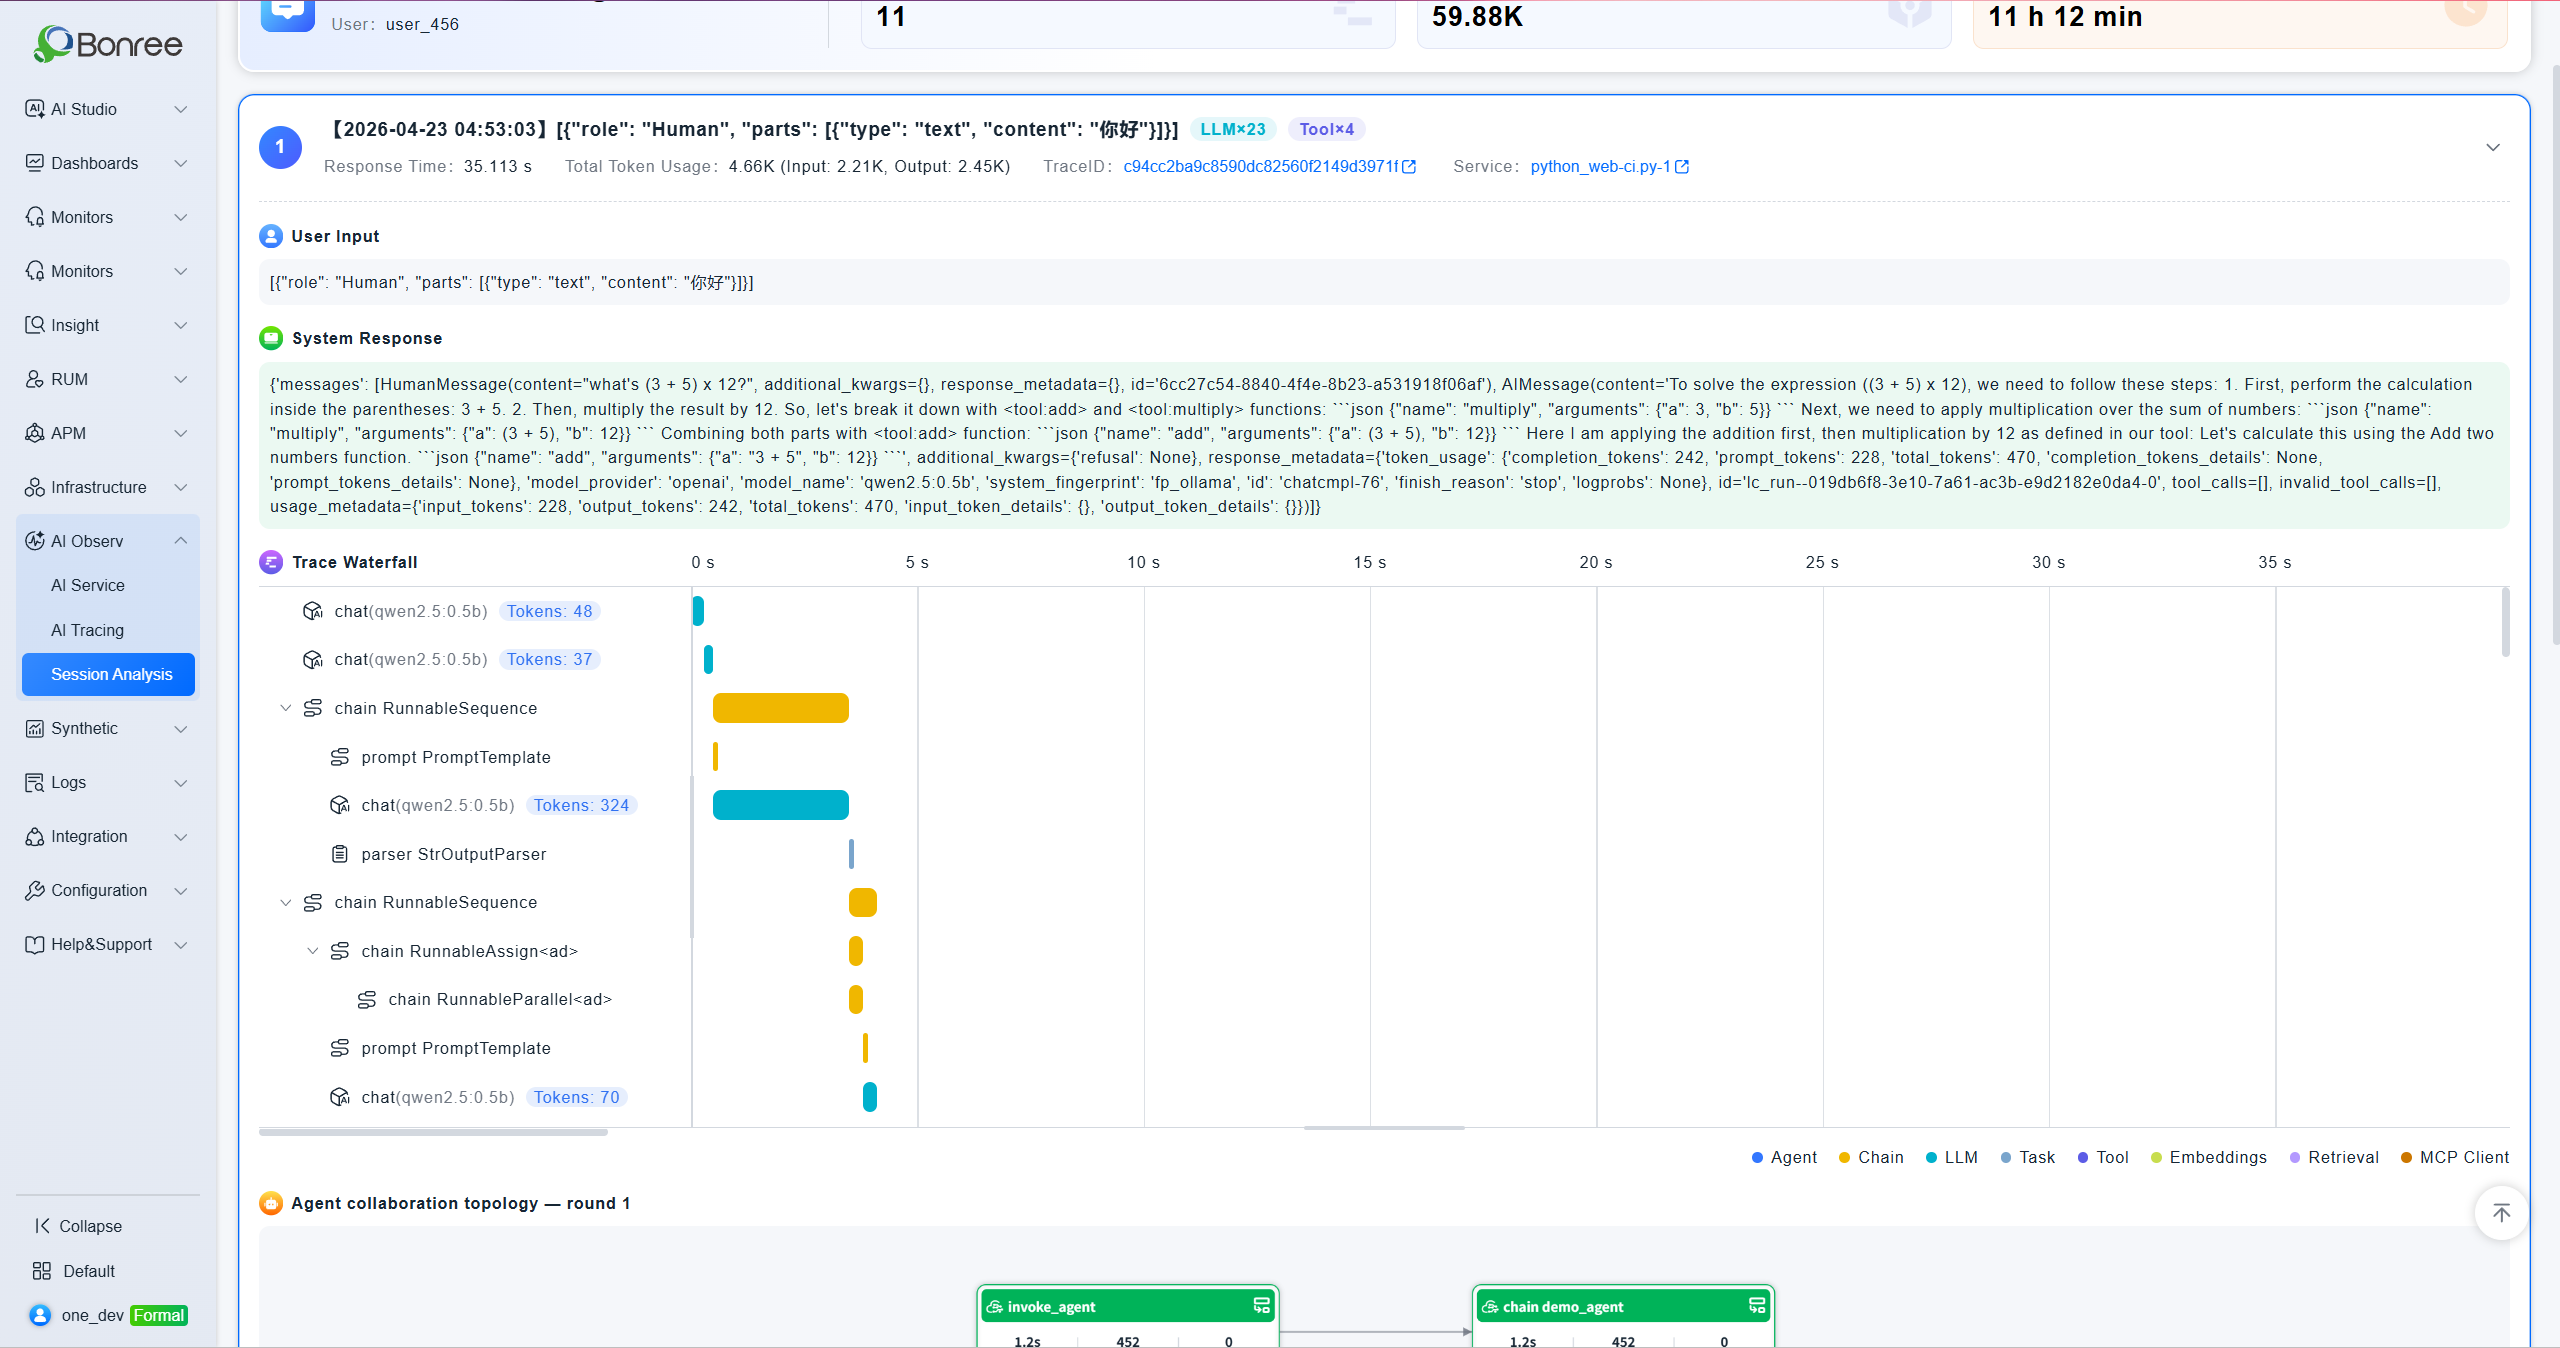
Expanding a Trace reveals its system response at the top, followed by a Trace Waterfall Chart — a Gantt-style diagram showing each Span's latency in hierarchical order, starting from 0s. The legend uses four colors to distinguish node types: Agent (blue), Chain (yellow), LLM (teal), Task (gray).
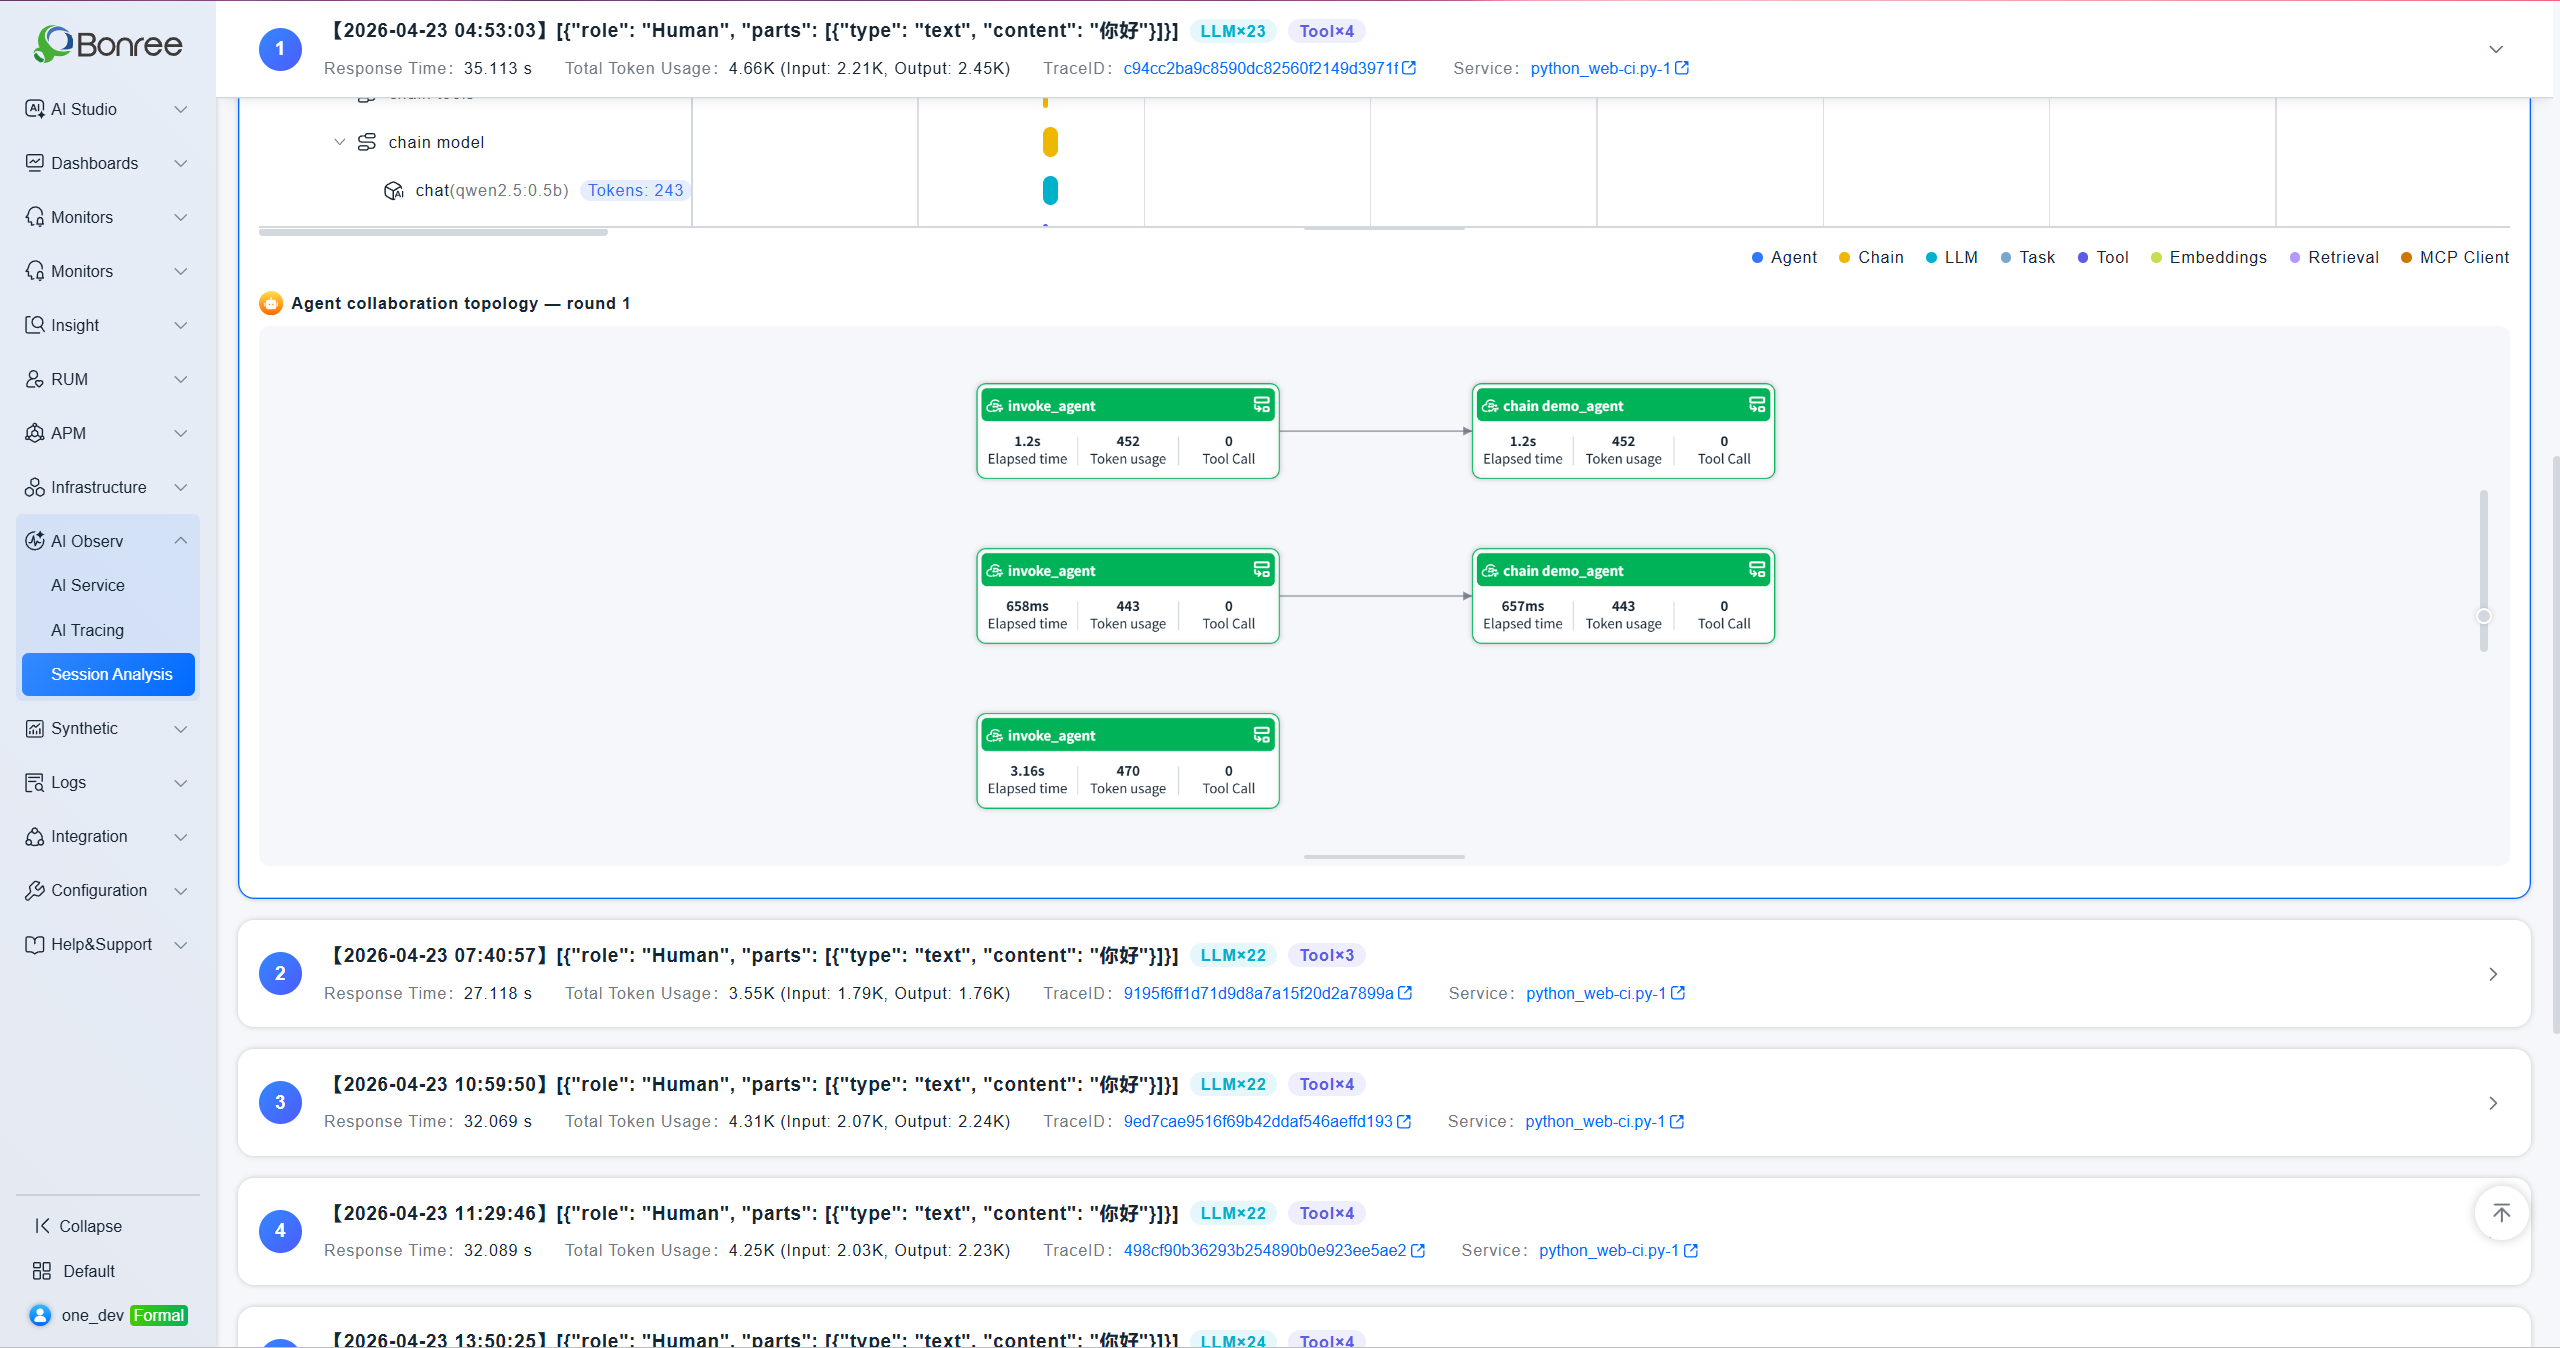
Agent Collaboration Topology
Below the waterfall chart, the Agent Collaboration Topology — Round N section displays each node in that Agent invocation round as a card showing its name, latency (ms), Token consumption, and call count. This visualizes the actual execution path and resource usage of the Agent.
Notes
Session Data Prerequisite: Session analysis depends on session attribute collection. Session IDs and user information are only reported after configuring session attribute mappings on the Server-side Request Parameters page.
Input Content Display: The Input preview in the Trace list is a truncated System Prompt summary. Open the call chain detail to view the full content.
LLM / Tool Badges: Each Trace displays
LLM×NandTool×Nbadges in the top-right corner, indicating the number of LLM and Tool node invocations within that Trace.
Trace Navigation: Trace IDs in the list are clickable links that navigate to the full call chain detail page for in-depth investigation.
Agent Topology Rounds: Each
invokenode corresponds to one round of Agent execution. When multiple rounds exist, the topology is displayed separately per round.