AI Service Analysis
Centrally manage and observe all monitored AI services. Supports multi-dimensional data views including requests, performance, Token consumption, model invocations, and alerts.
Core Capabilities
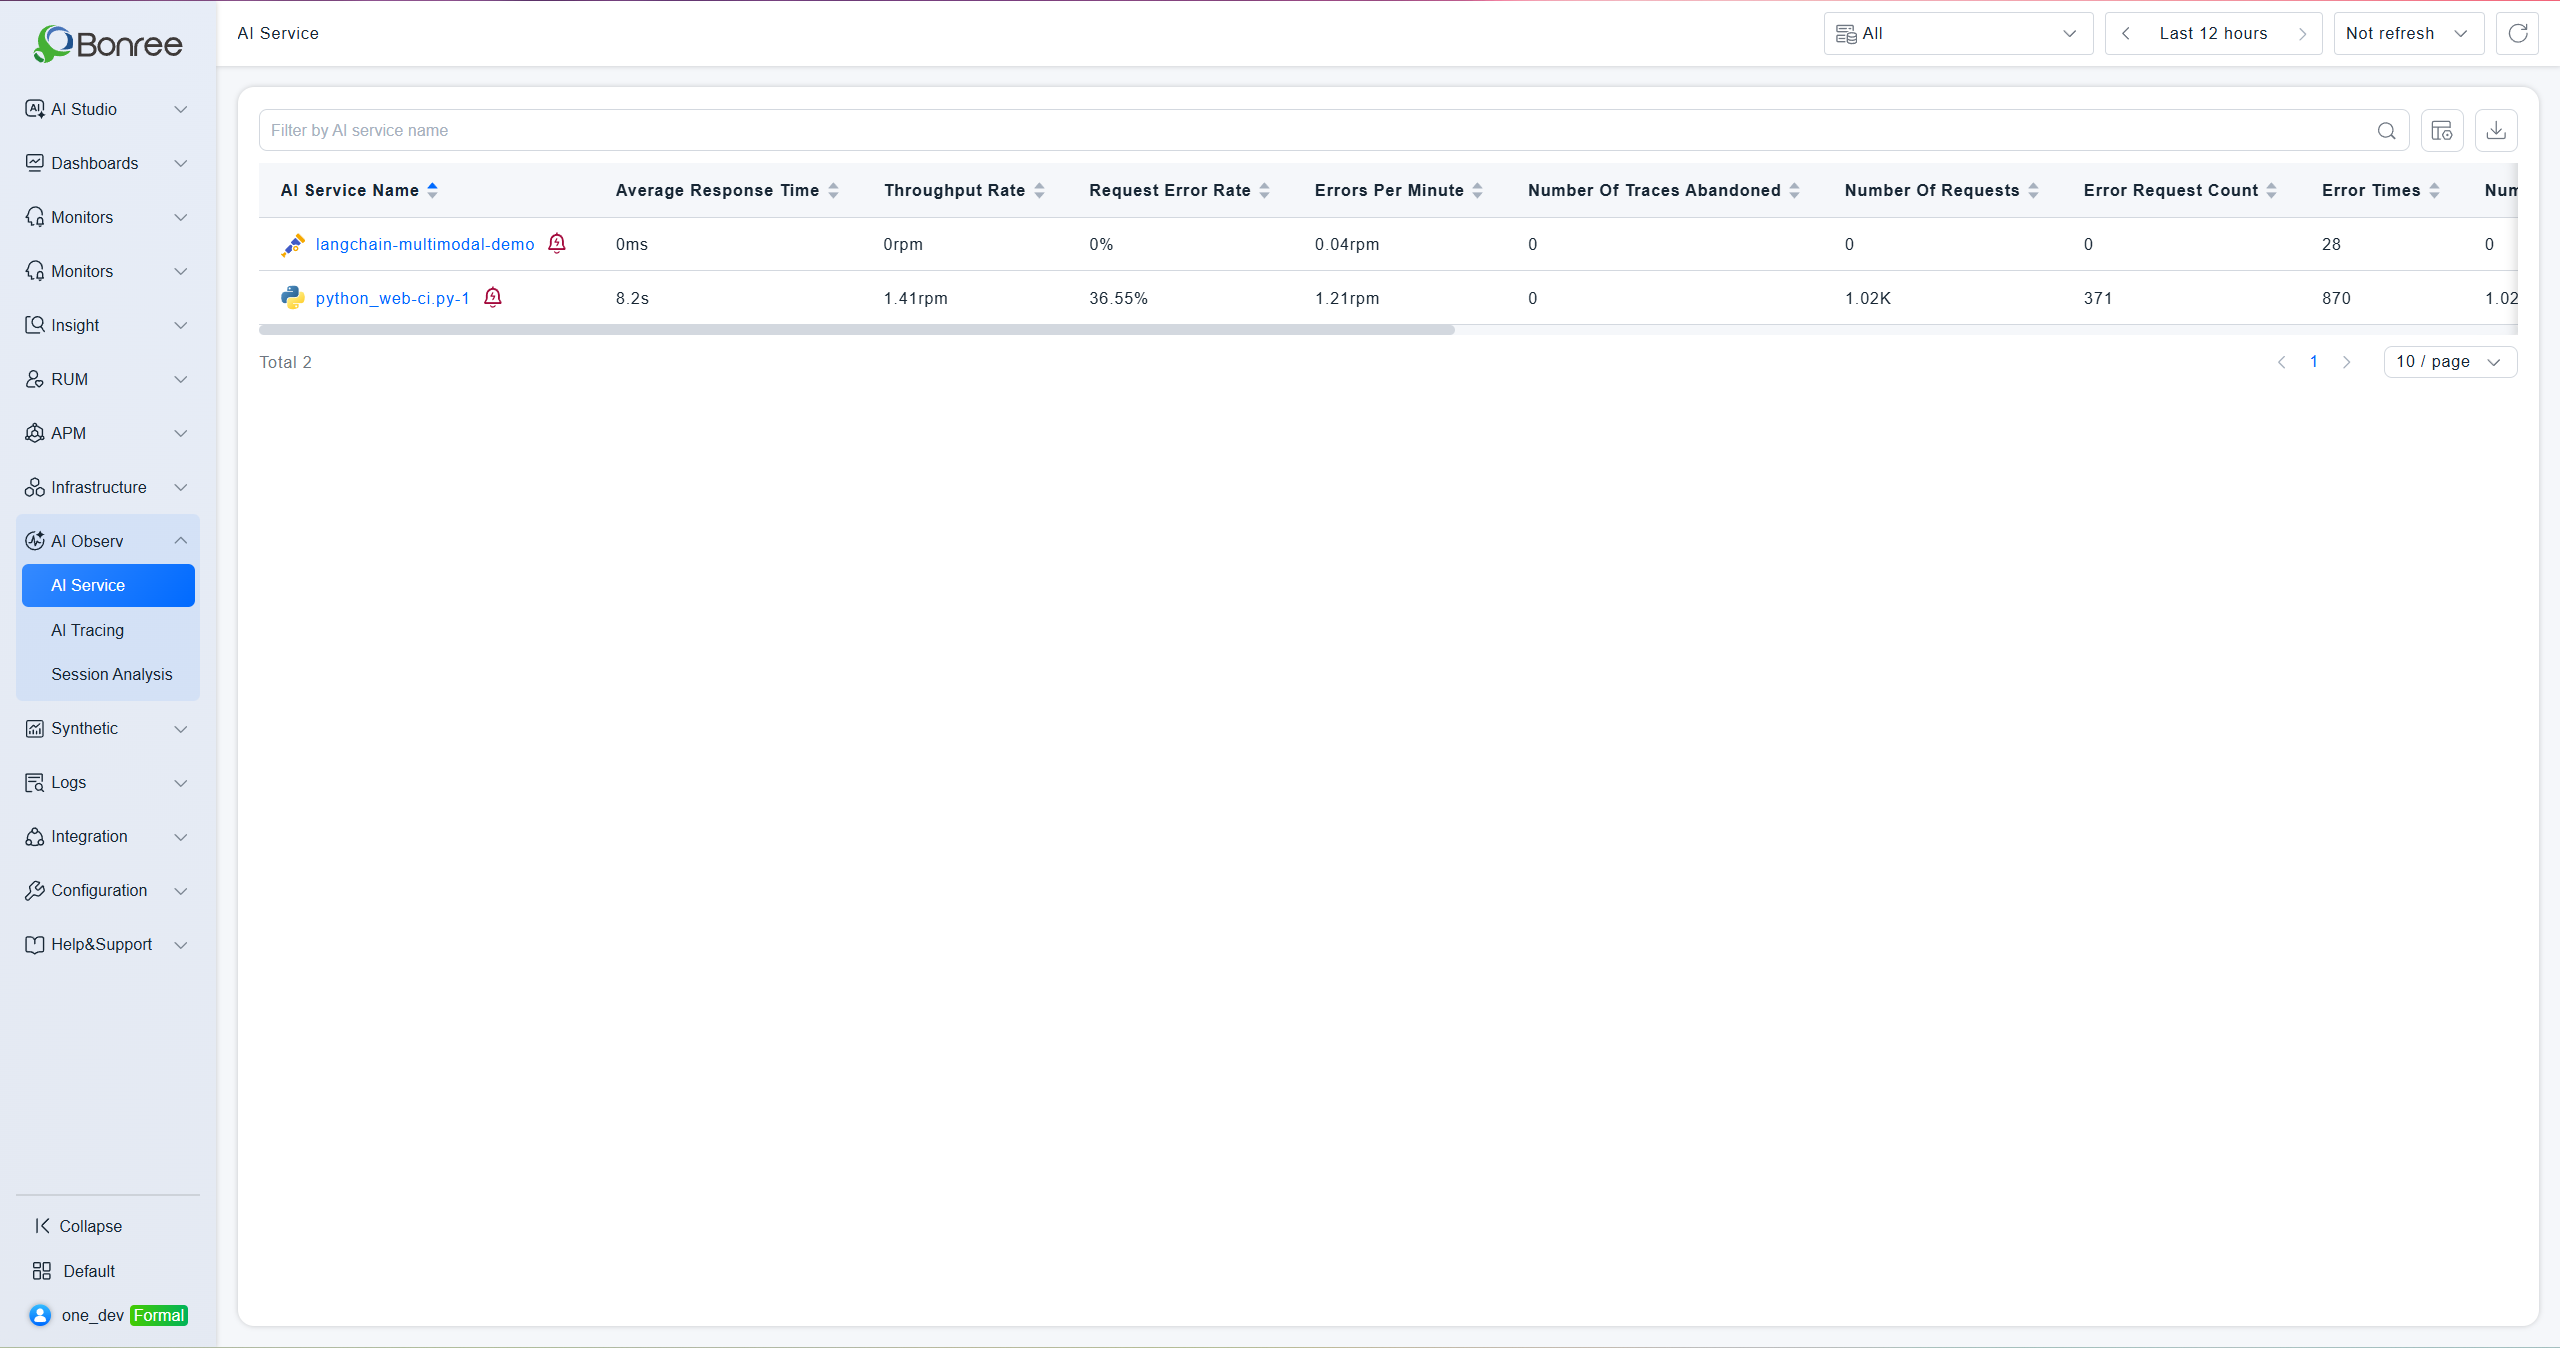
- Service Overview: View key metrics for all AI services in a unified list — including request count, error rate, response time, and Token consumption — to quickly identify anomalies.
- Call Chain Analysis: Inspect each AI invocation's Input/Output content, response time, and status. Filter by service name, Trace ID, user ID, or session ID.
- Performance View: Aggregate LLM service metrics including response time, request count, error count, and model request count, with trend charts comparing against the previous day.
- Token View: Track total Token consumption per LLM service, with per-model breakdowns of Input/Output Token distribution and consumption trends.
- Model View: Summarize invocation count, average latency, error count, and Token consumption by model, enabling cross-model comparison within the same service.
- Alert Integration: View associated alerts directly within the service detail page. Filter by severity level (Critical / Major / Warning / Normal / Notice) and status, with support for bulk close and export.
Use Cases
- Detecting High Error Rate Services: Spot an service with a sudden spike in error rate in the list, then drill into Call Chain Analysis to identify the specific failed request's Input/Output content.
- Monitoring Token Costs: Use the Token View to analyze Input/Output Token distribution across models, identify abnormal consumption, and support cost optimization decisions.
- Comparing Model Performance: Use the Model View to compare response latency and error rates across different models within the same service, helping you select the optimal model configuration.
Feature Guide
AI Service List
The list displays core metrics for all connected AI services: request count, request error rate, average response time, total Token consumption, discarded trace count, errors per minute, throughput rate, collected trace count, error count, failed request count, and last monitored time. You can search by service name and export data.
AI Service Detail
Click an service name to enter the detail page. The top section shows the service's health status, monitoring duration, last report time, associated service instances, and five key metric cards — request count, request error rate, average response time, Token usage, and top 3 related model invocations — each with day-over-day comparison. The detail page contains six sub-tabs:
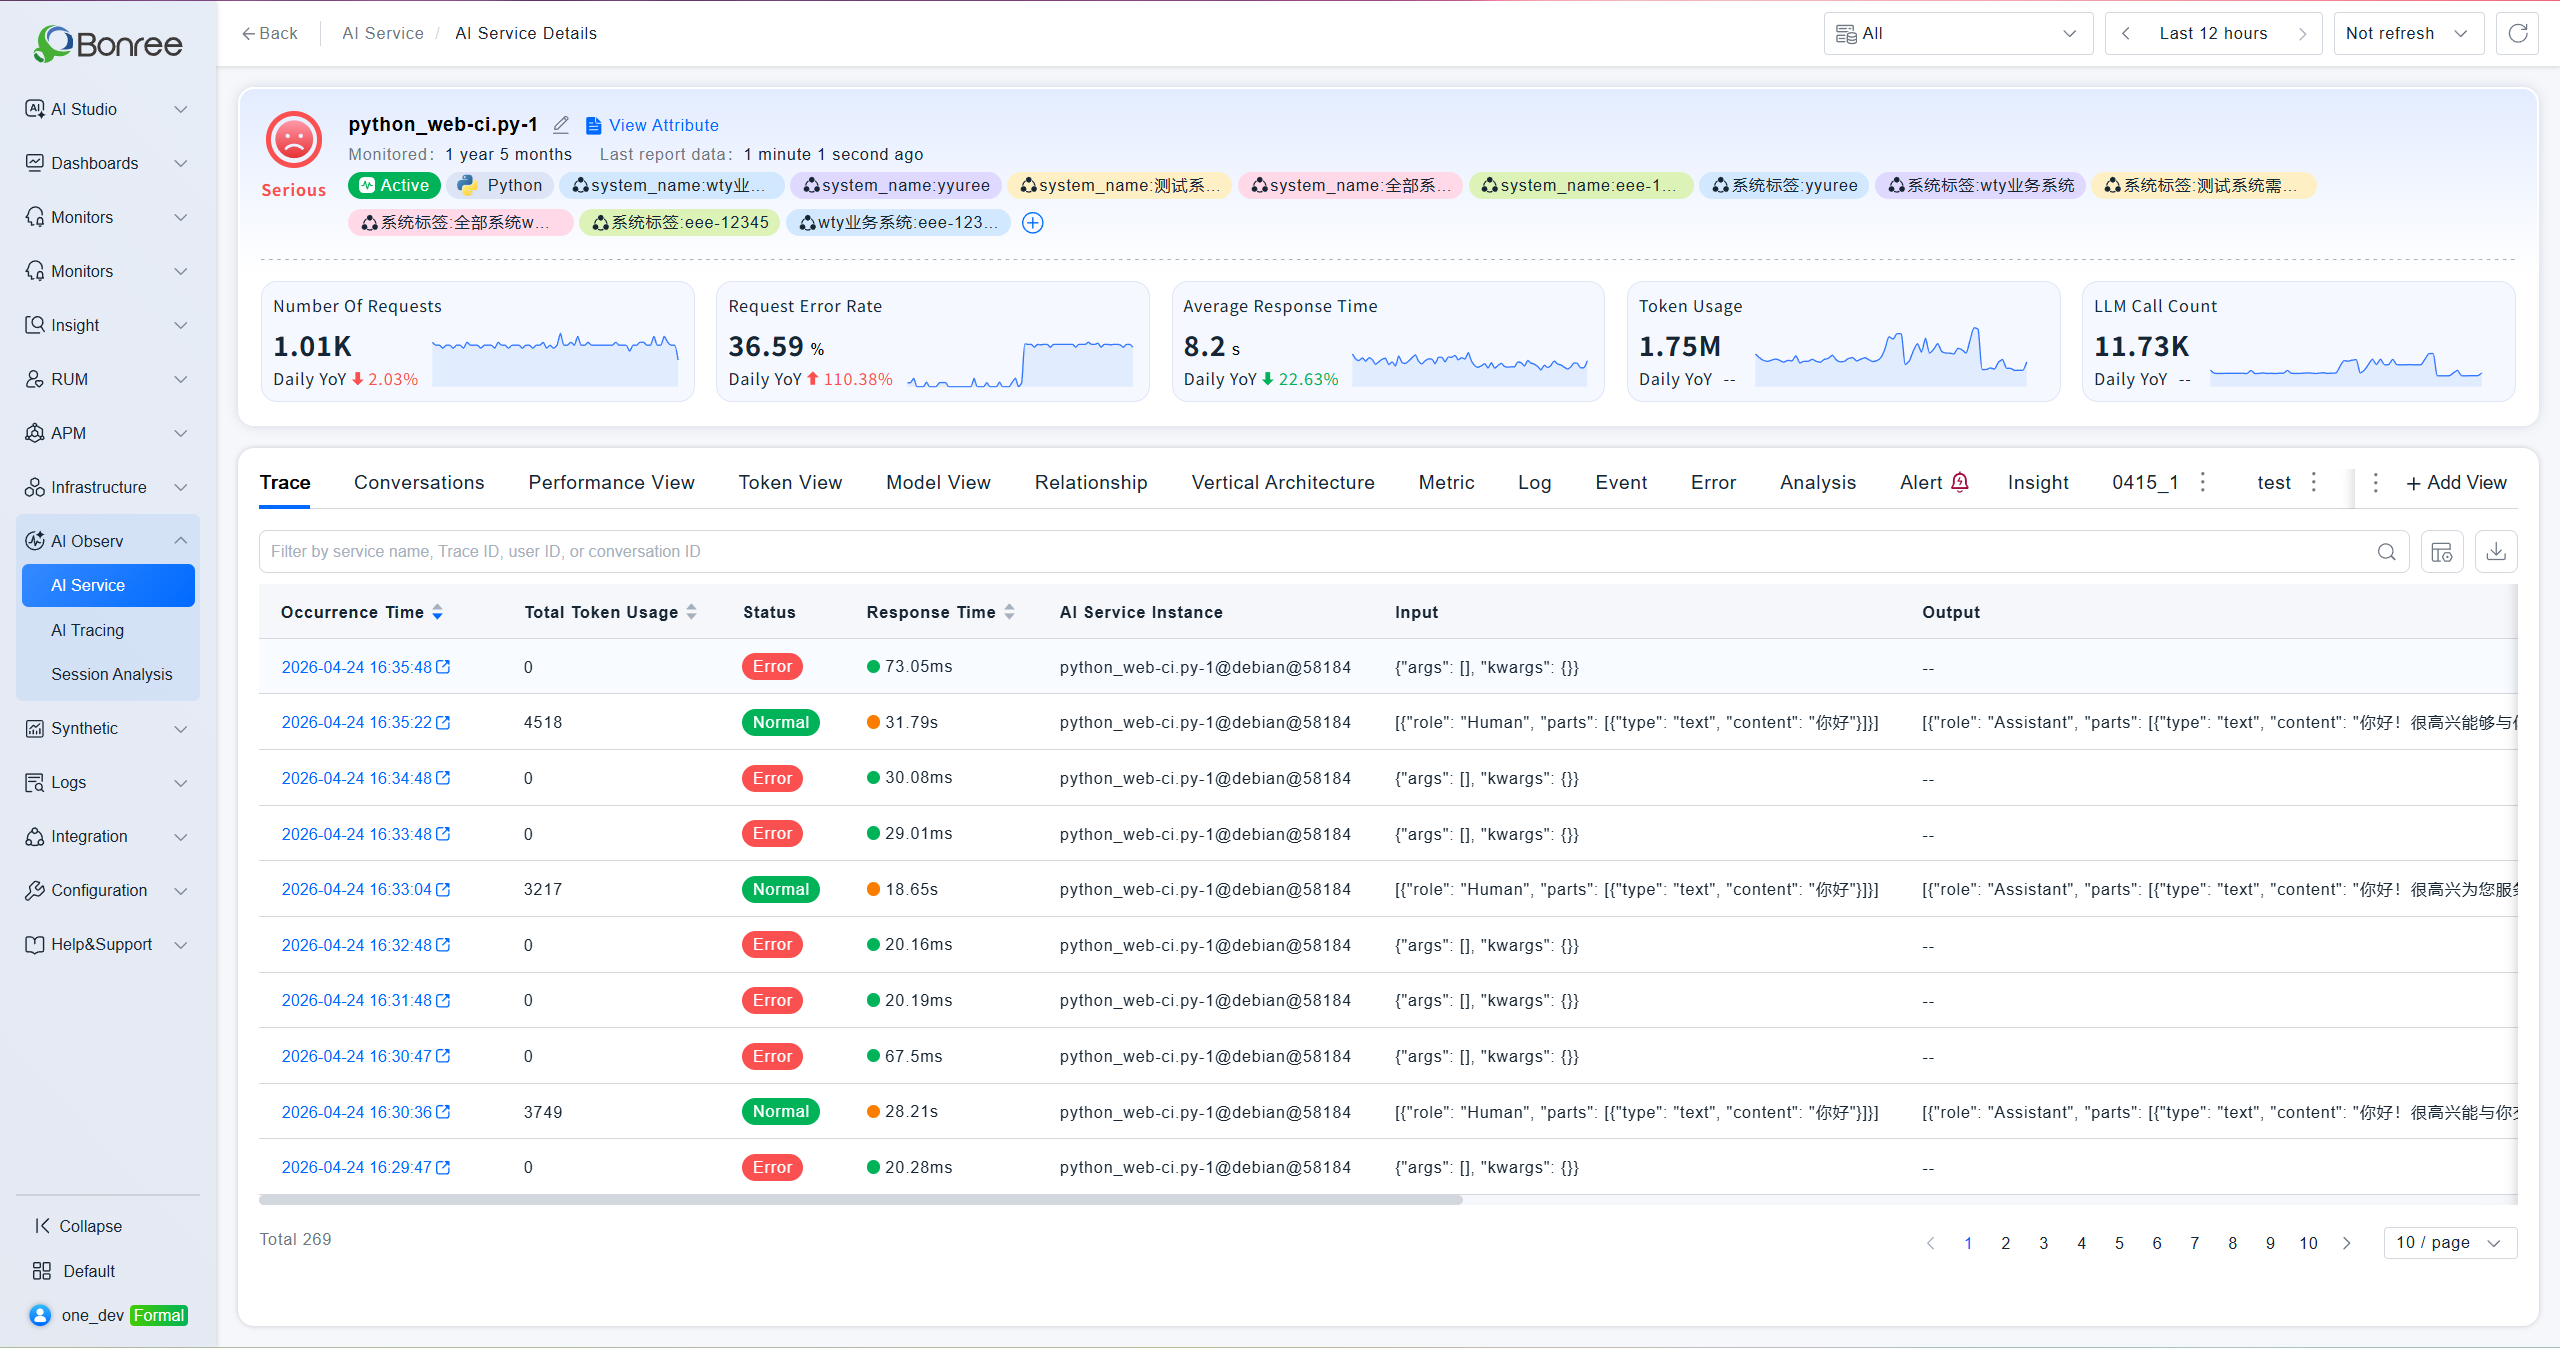
Trace Analysis
Displays each AI invocation record with timestamp, status, response time, Input content, Output content, and Trace ID. Filter by service name, Trace ID, user ID, or session ID. Click the timestamp to jump to the full Trace detail page.
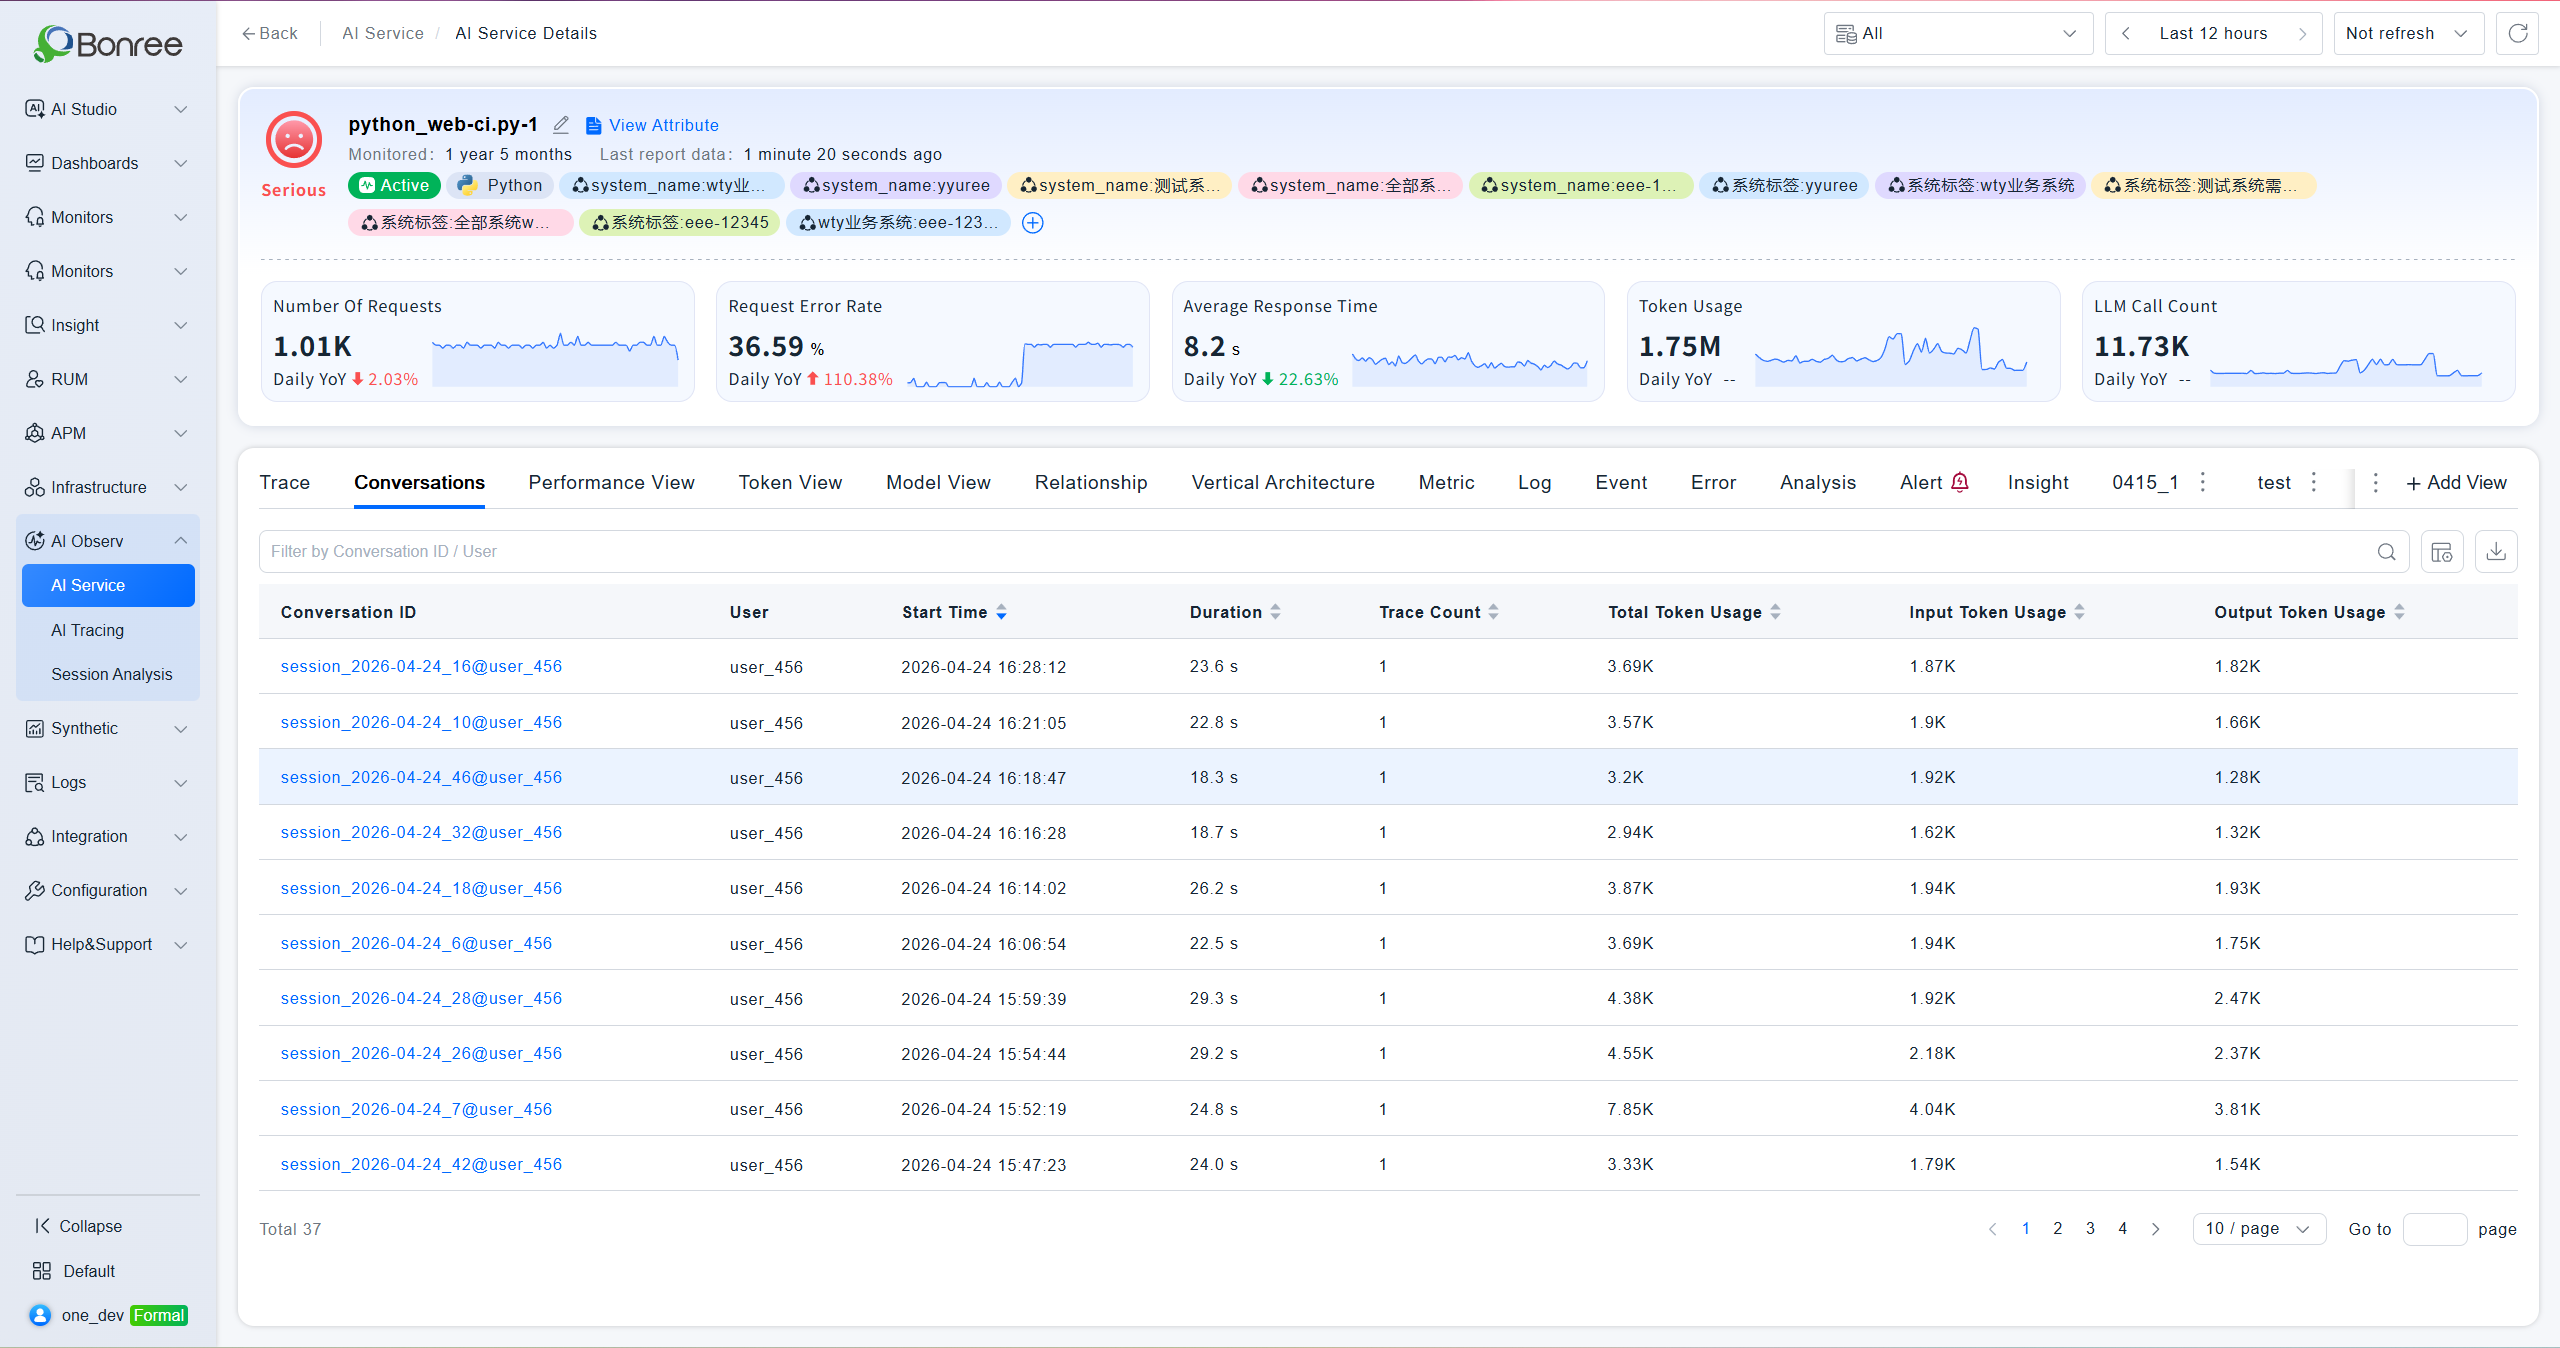
Conversation Analysis
Display a list of AI service conversation records, including duration, conversation ID, token consumption, number of traces, etc. Click the occurrence time to jump to the full Conversation Analysis details.
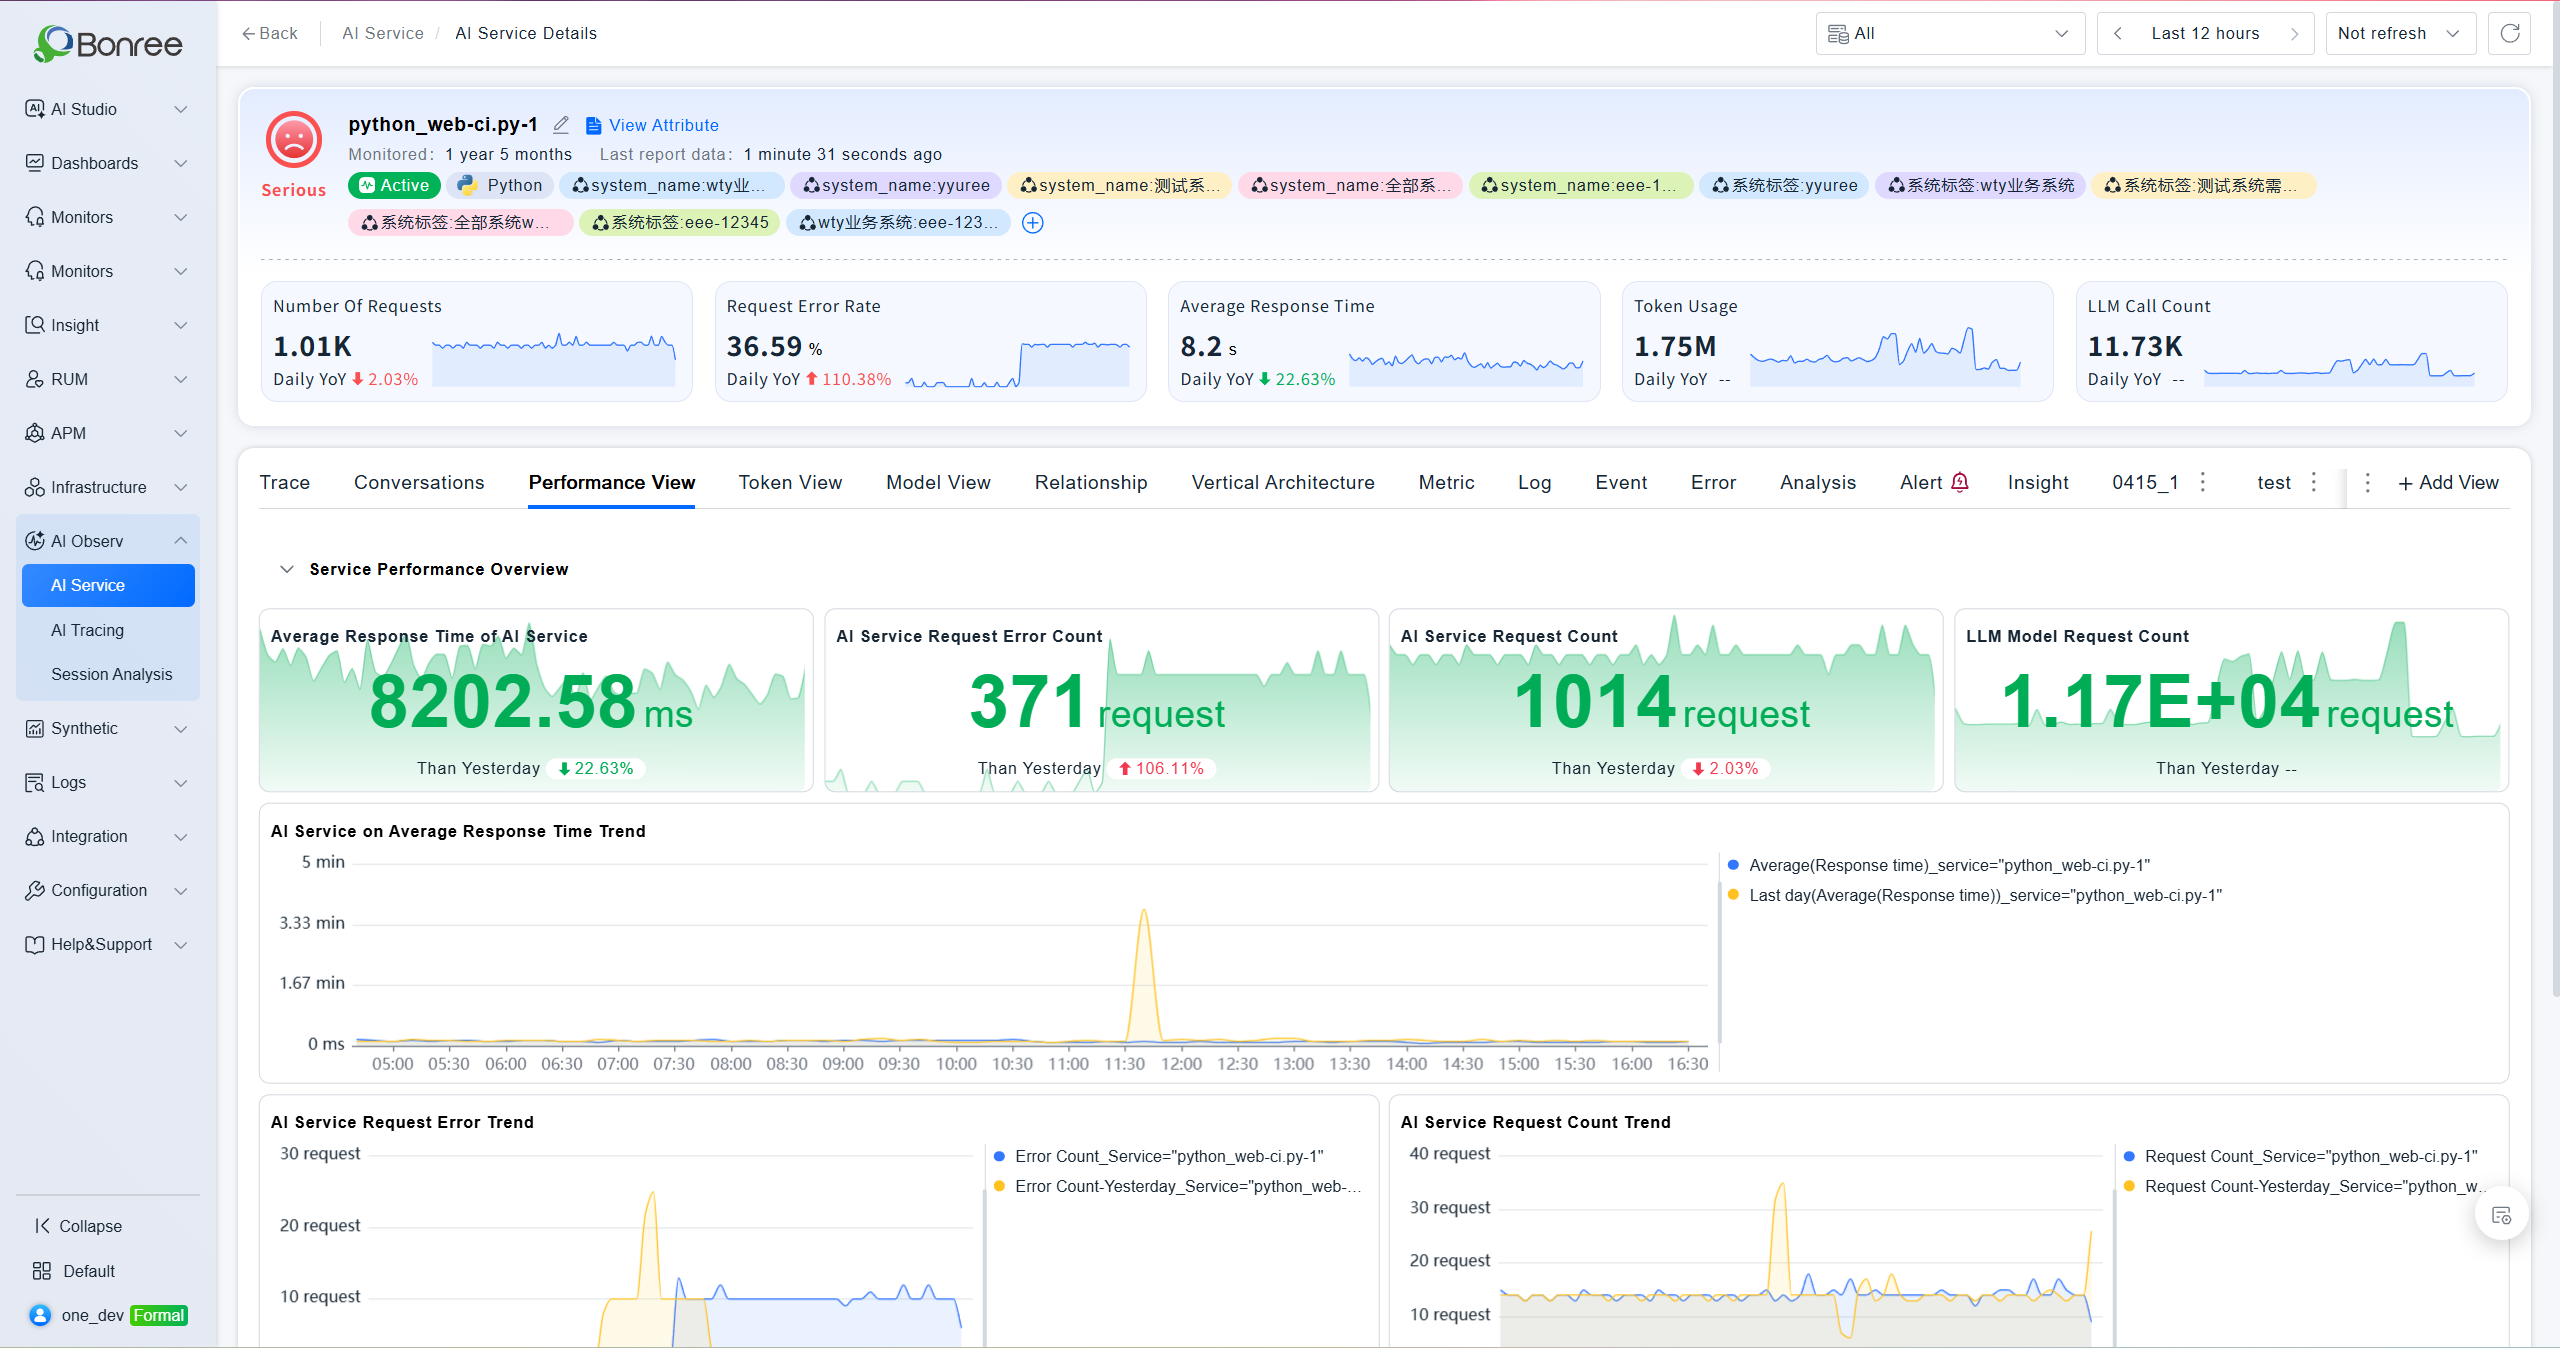
Performance View
Shows an service performance summary with four overview metrics: LLM service average response time, request error count, request count, and model request count. Includes trend charts for response time, errors, and request volume. Supports filtering by instance ID.
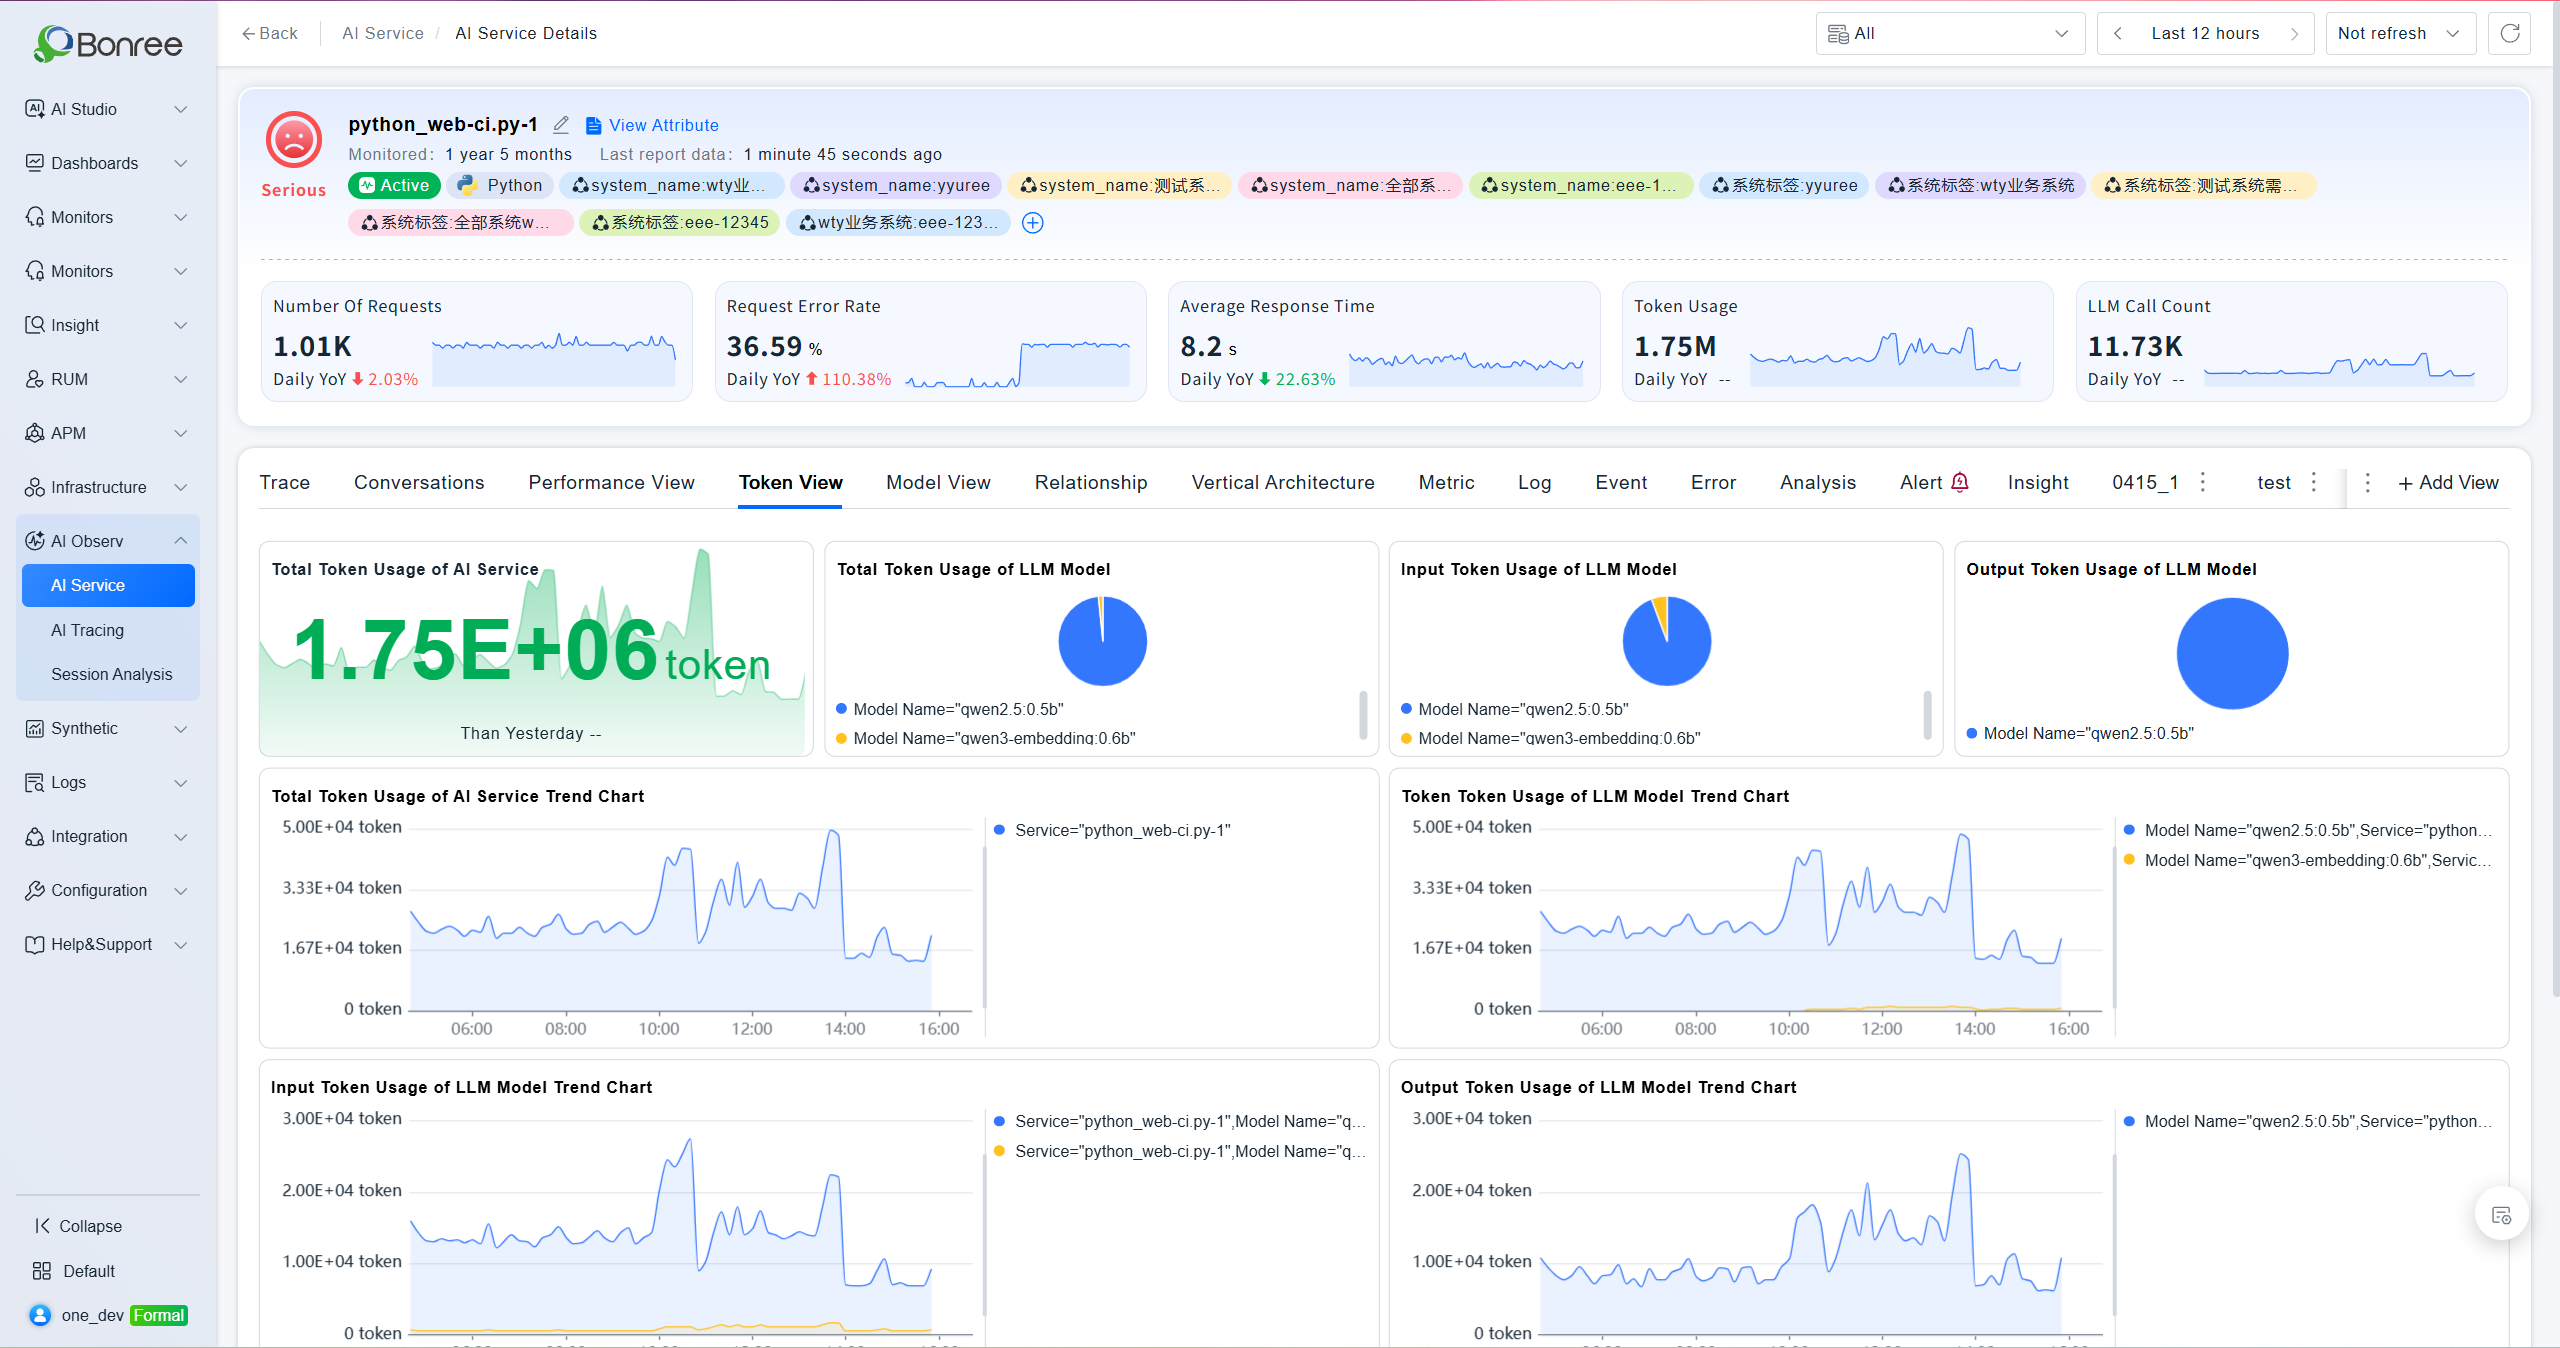
Token View
Displays a Token consumption summary including: LLM service total Token consumption, model total Token distribution, model Input Token distribution, model Output Token distribution, and trend charts for both LLM service and model-level Token consumption.
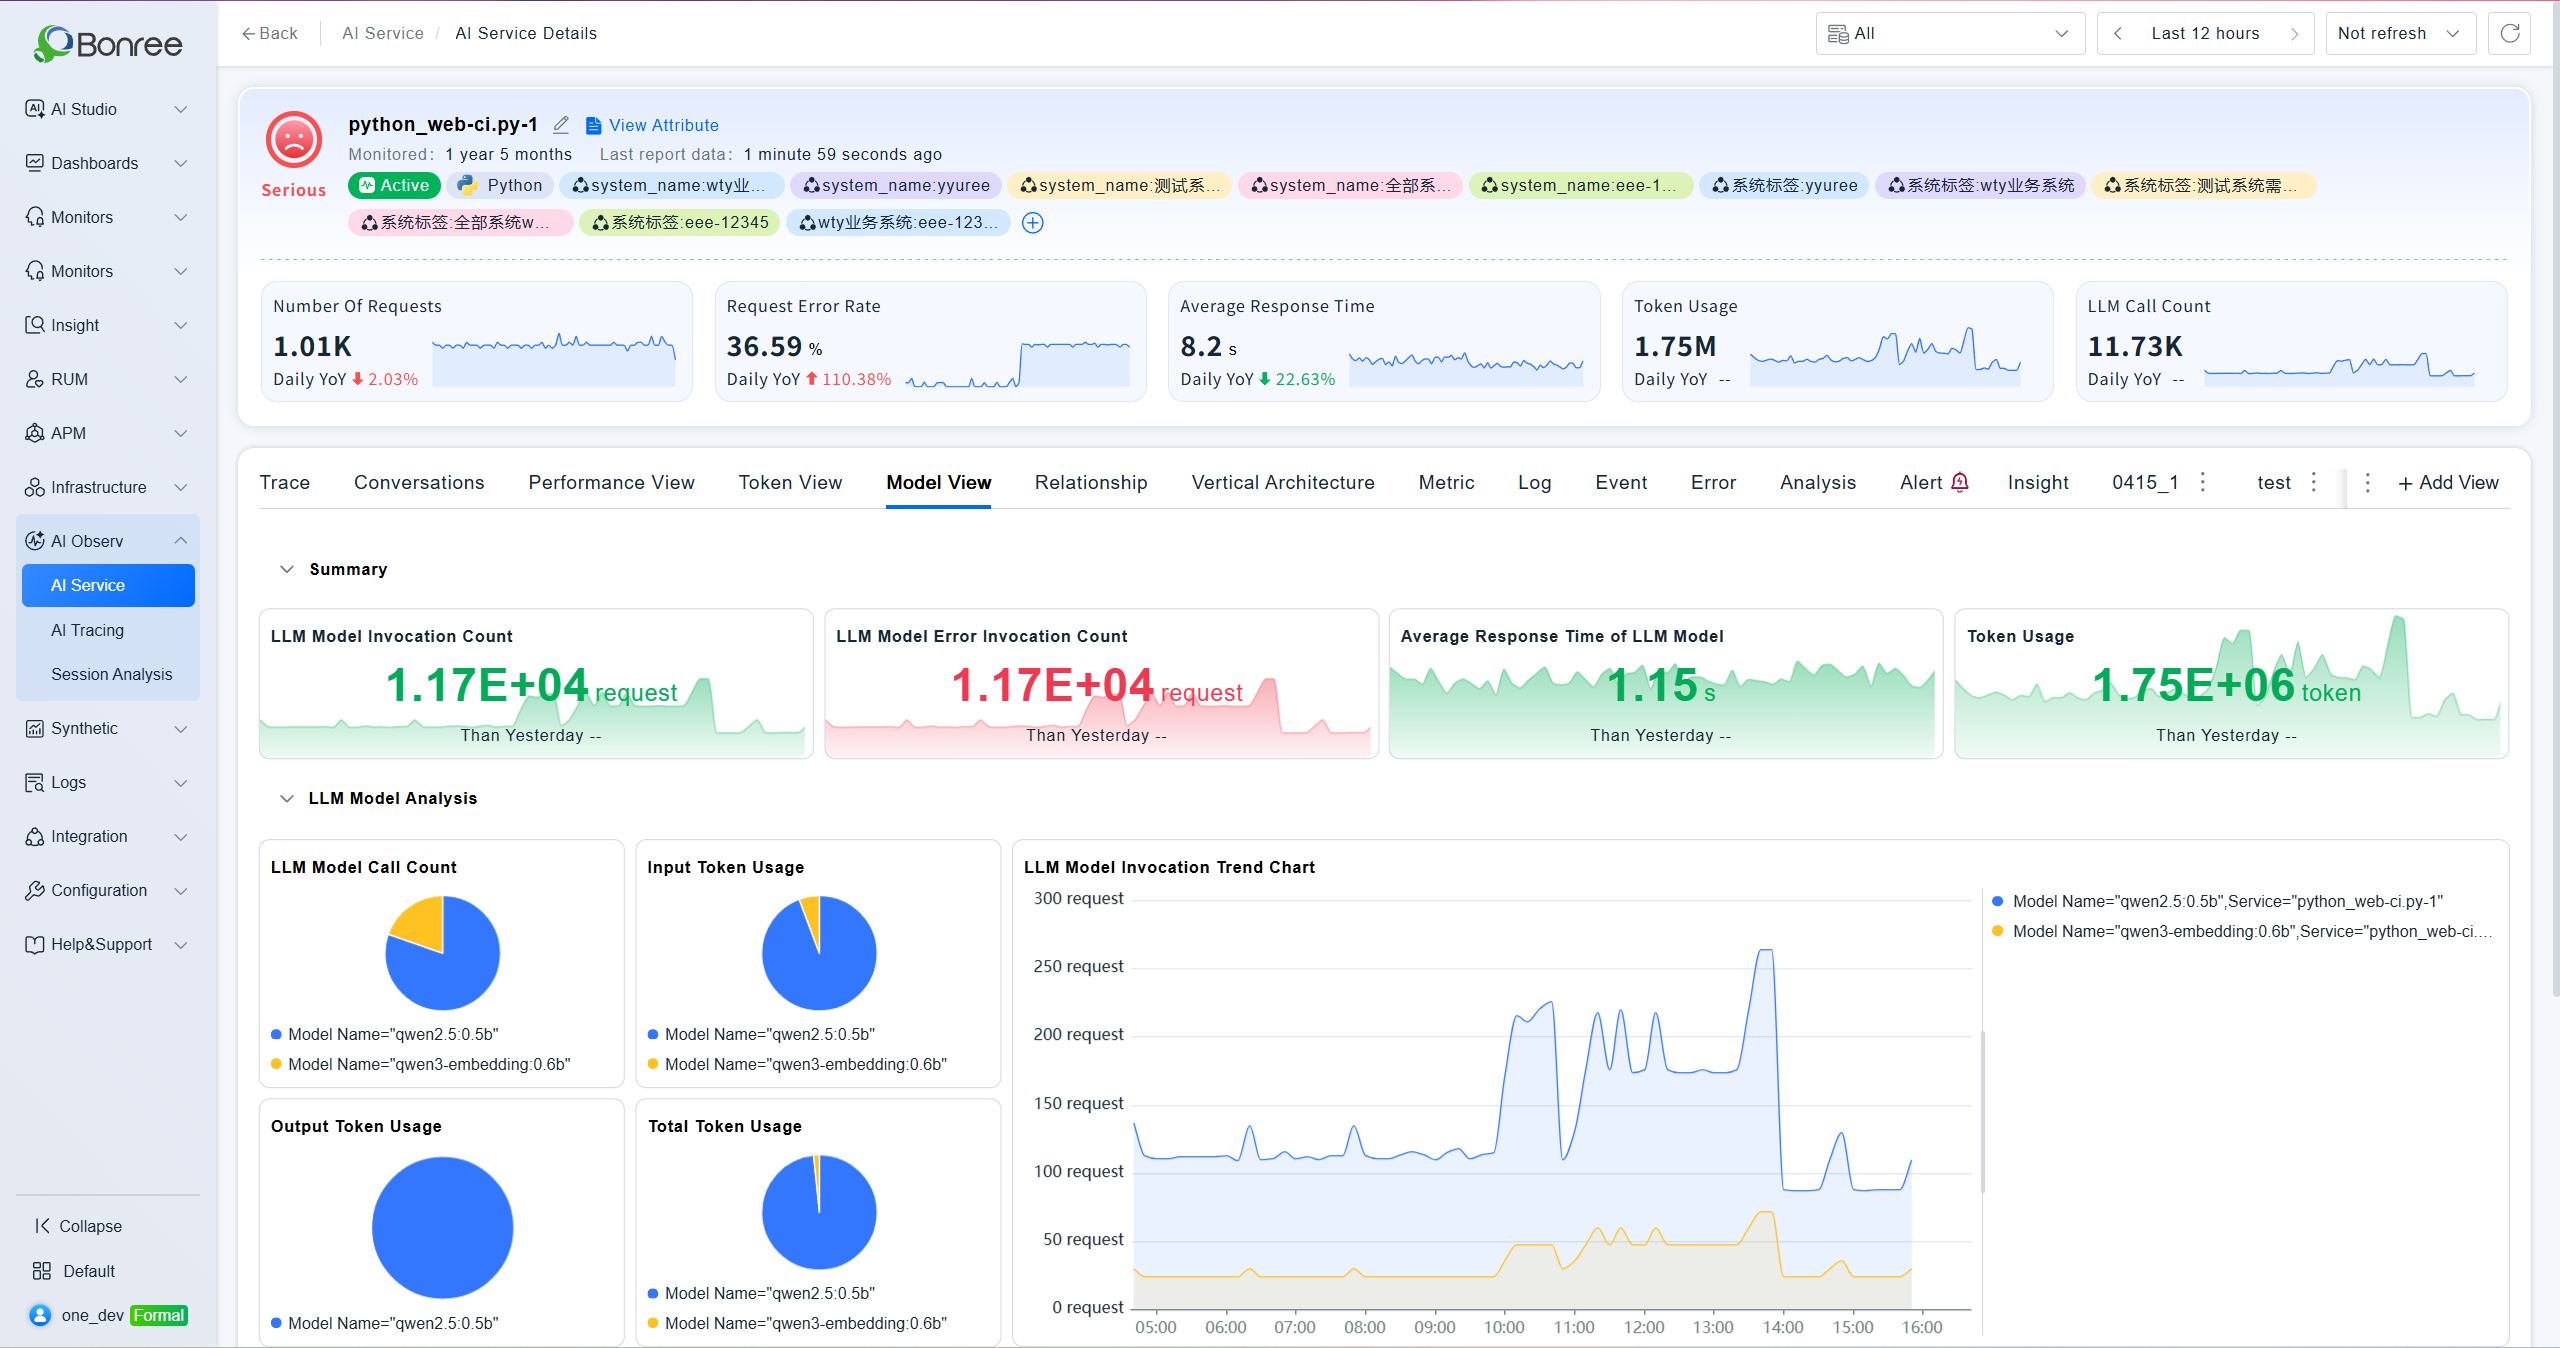
Model View
Aggregates data by model with four overview metrics: model invocation count, average response latency, error invocation count, and Token consumption. A model analysis section below provides detailed per-model comparison data.
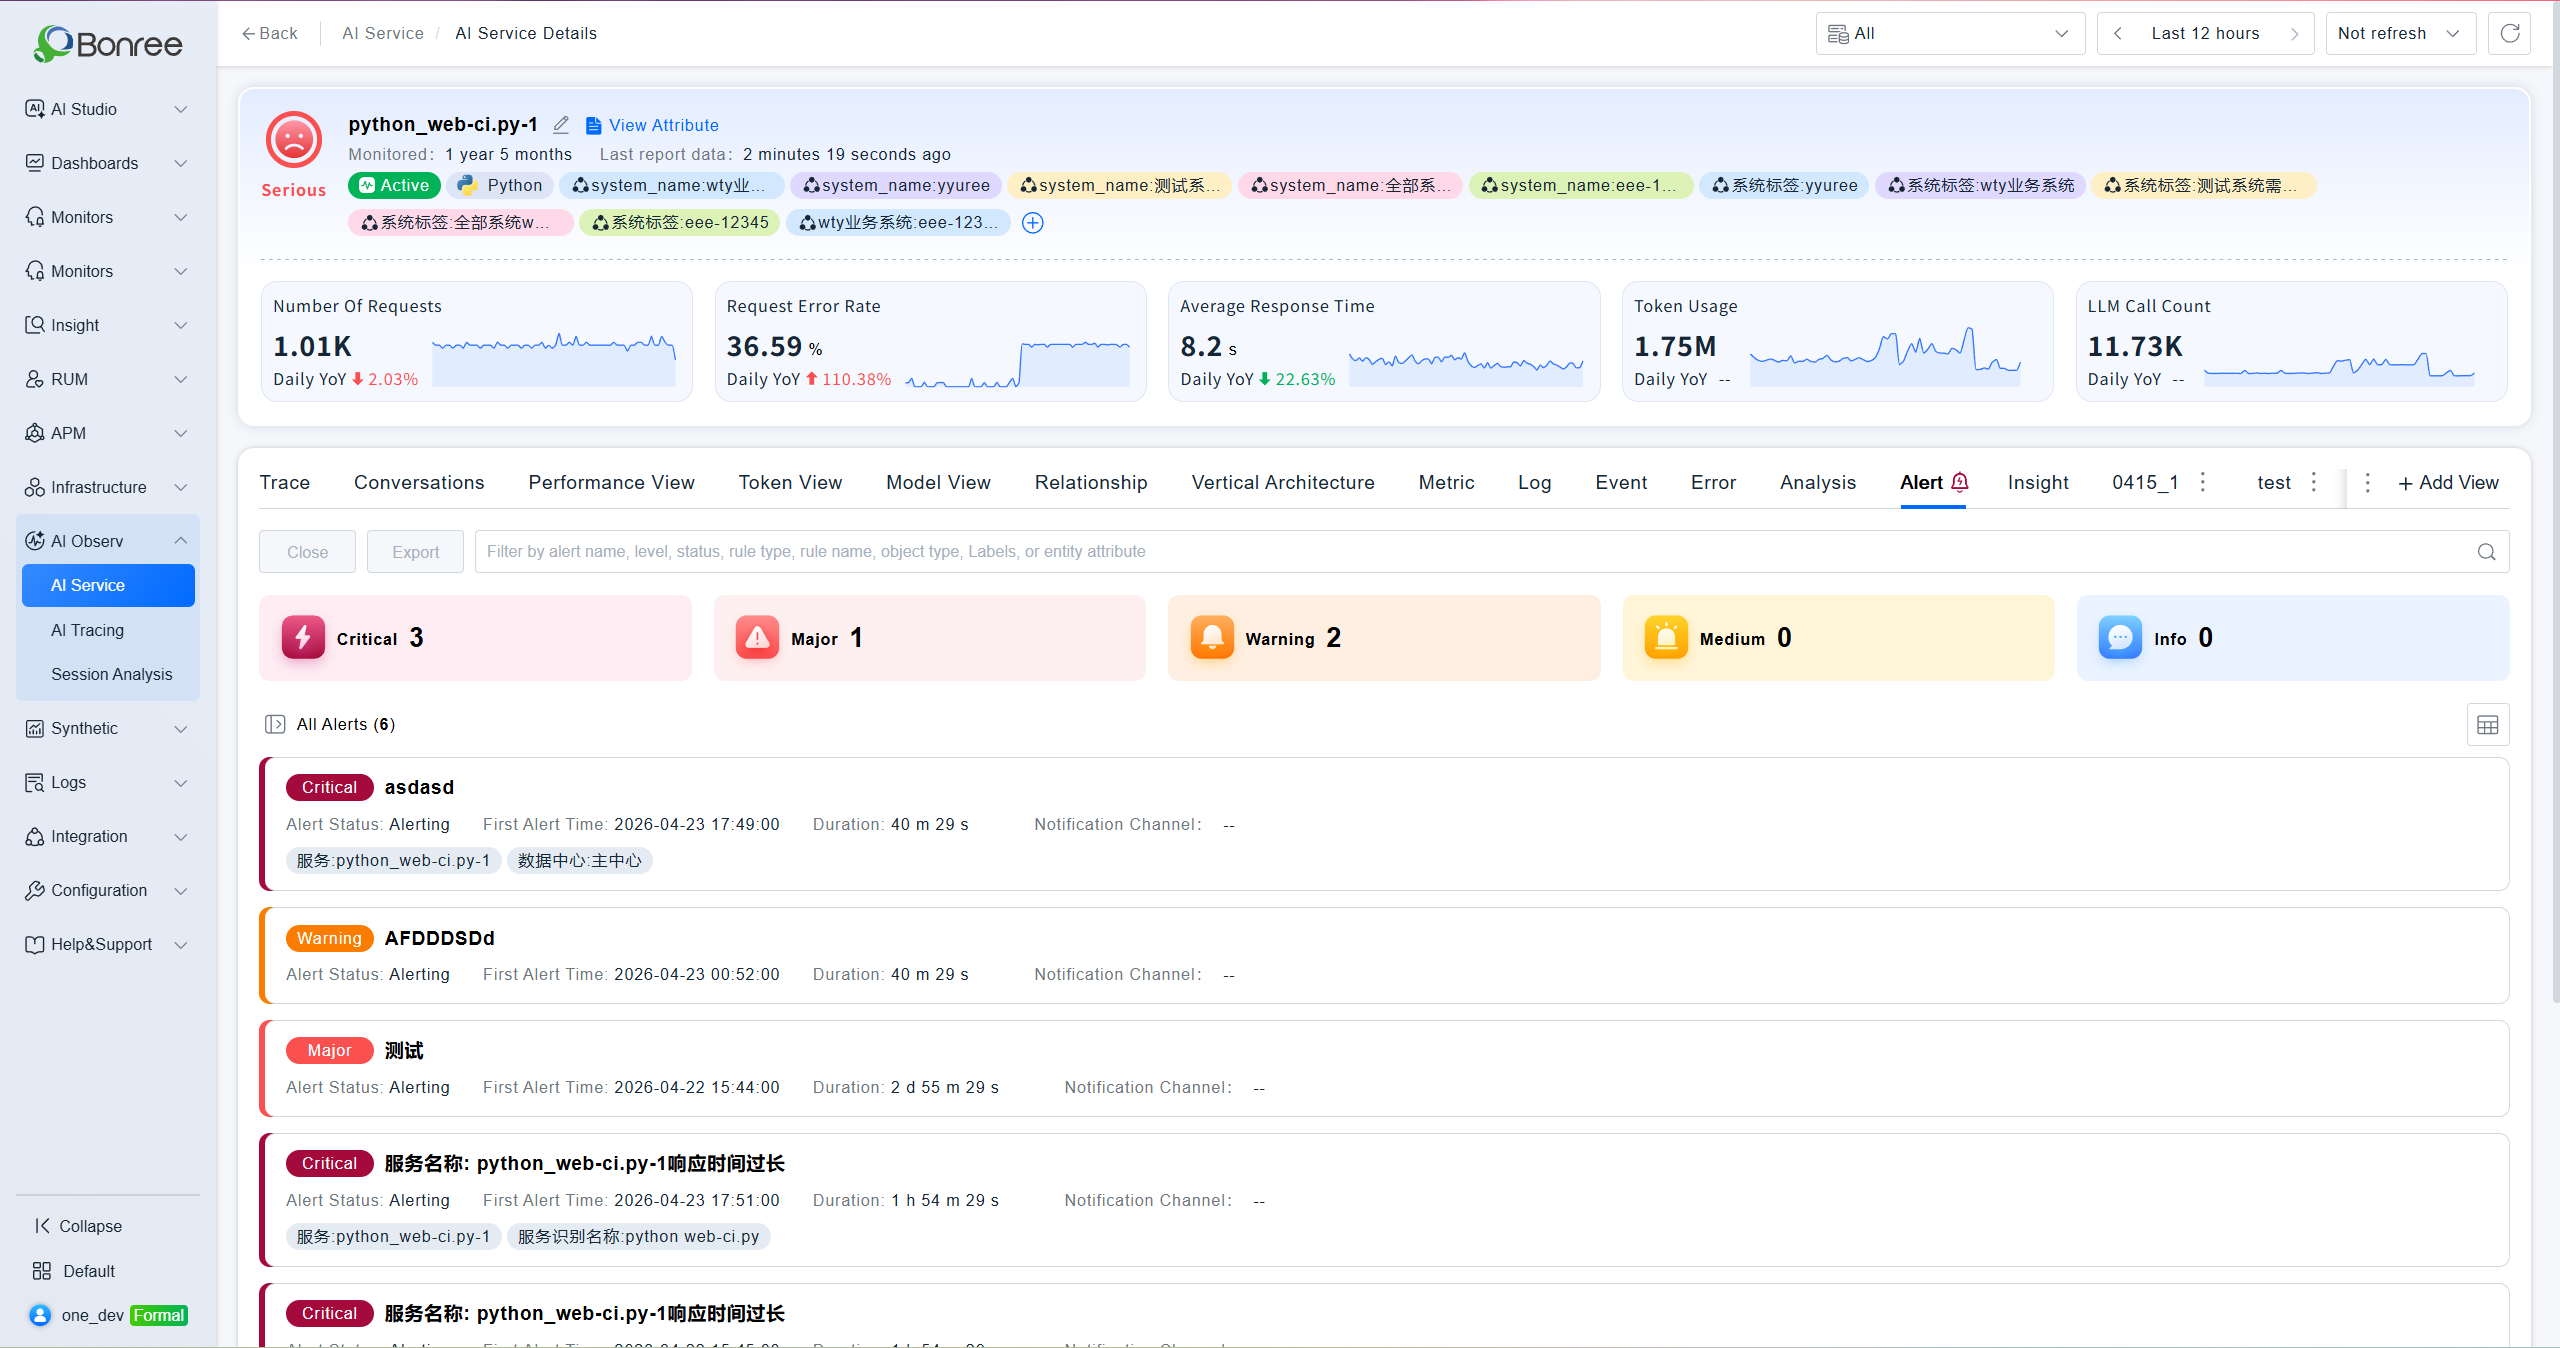
Alerts
Displays all alerts associated with the current service, grouped into five severity levels: Critical, Major, Warning, Normal, and Notice. The left panel provides filters by status (Recovered / Alerting / No Data / Closed) and rule type (Threshold / Log / Event). Each alert shows name, level, status, start time, duration, and notification method. Supports bulk close and export.
Notes
Data Prerequisite: AI service data depends on probe collection. Ensure probe version ≥ 9.13.0 and that AI Invocation Monitoring is enabled; otherwise the list will be empty.
Day-over-Day Comparison: The day-over-day values in the detail page metric cards compare against the same time window yesterday. Changing the time range will affect the comparison result.
Model View Data: Model analysis requires model invocation data to be available. If no data exists, metric cards will show "No Data."
Alert Association: The Alerts tab only shows alerts linked to the current AI service. To manage alert rules, go to the Smart Alerts module.
Trace Navigation: Clicking a timestamp in the Call Chain Analysis list navigates to the full Trace detail page for in-depth investigation.