Business Observability Implementation Steps
Use these steps to build the first usable business trace. When complete, the Business Trace page shows the target business state and key metrics, and the topology provides access to node details.
Before you begin
- Verify that you can view and edit Business Observability.
- Define the critical business path and where requests enter it.
- Verify that critical business entities are available from one of these sources:
| Data source | Typical data | Check before you begin |
|---|---|---|
| Agent | Hosts, processes, services, application runtime data, and their relationships | The target entities exist and continue to report data for the expected time range. |
| Data Integration | Metrics, alerts, logs, and traces from external systems, components, cloud services, or monitoring platforms | The integration is enabled and the target data is queryable. |
For ingestion instructions, see SmartAgent and Data Integration.
1. Define the minimum business scope
Start with a critical path that has a verifiable business outcome:
- Identify the system or service where requests enter.
- Select the critical nodes that directly affect the outcome and confirm their direction.
- Choose request volume, response time, error rate, or other metrics that represent the outcome.
- Decide which anomalies should be reflected through alert states.
Keep only required nodes in the first version. Add interfaces, technical components, and vertical architecture after validating the data and metric scope.
2. Create the business trace
- Go to Insight → Business OB → Business Trace.
- Click Create Business Trace, enter a recognizable business name, and save it.
- Add systems, services, or other critical nodes from the left panel.
- Drag an edge from each upstream node to its downstream node and match the real request direction.
- Set the point where requests enter as the Entry Node.
If observable call relationships already exist, use Discover Relationships to add services and edges for a time range and selected interfaces. If only selected interfaces are relevant, use Define Interface on the edge to limit the aggregation scope.
3. Configure health signals
| Configuration | How to use it | Result |
|---|---|---|
| Node key metrics | Select a metric or define one with an expression for a critical node | The metric appears on the node card. |
| Business trace key metrics | Select metrics that represent the outcome of the whole trace | The metrics appear on the health dashboard and trace details. |
| Alert rules | Associate existing alert rules when needed | Triggered rules provide an alert count and state. |
| Vertical architecture | Add resource relationships for technical components or third-party entities | Users can continue to hosts, processes, and service instances. |
The entry node affects core metric calculations. It uses first-level downstream edges; other nodes use their upstream edges.
For all configuration options, see Create and Configure Business Traces.
4. Validate the implementation
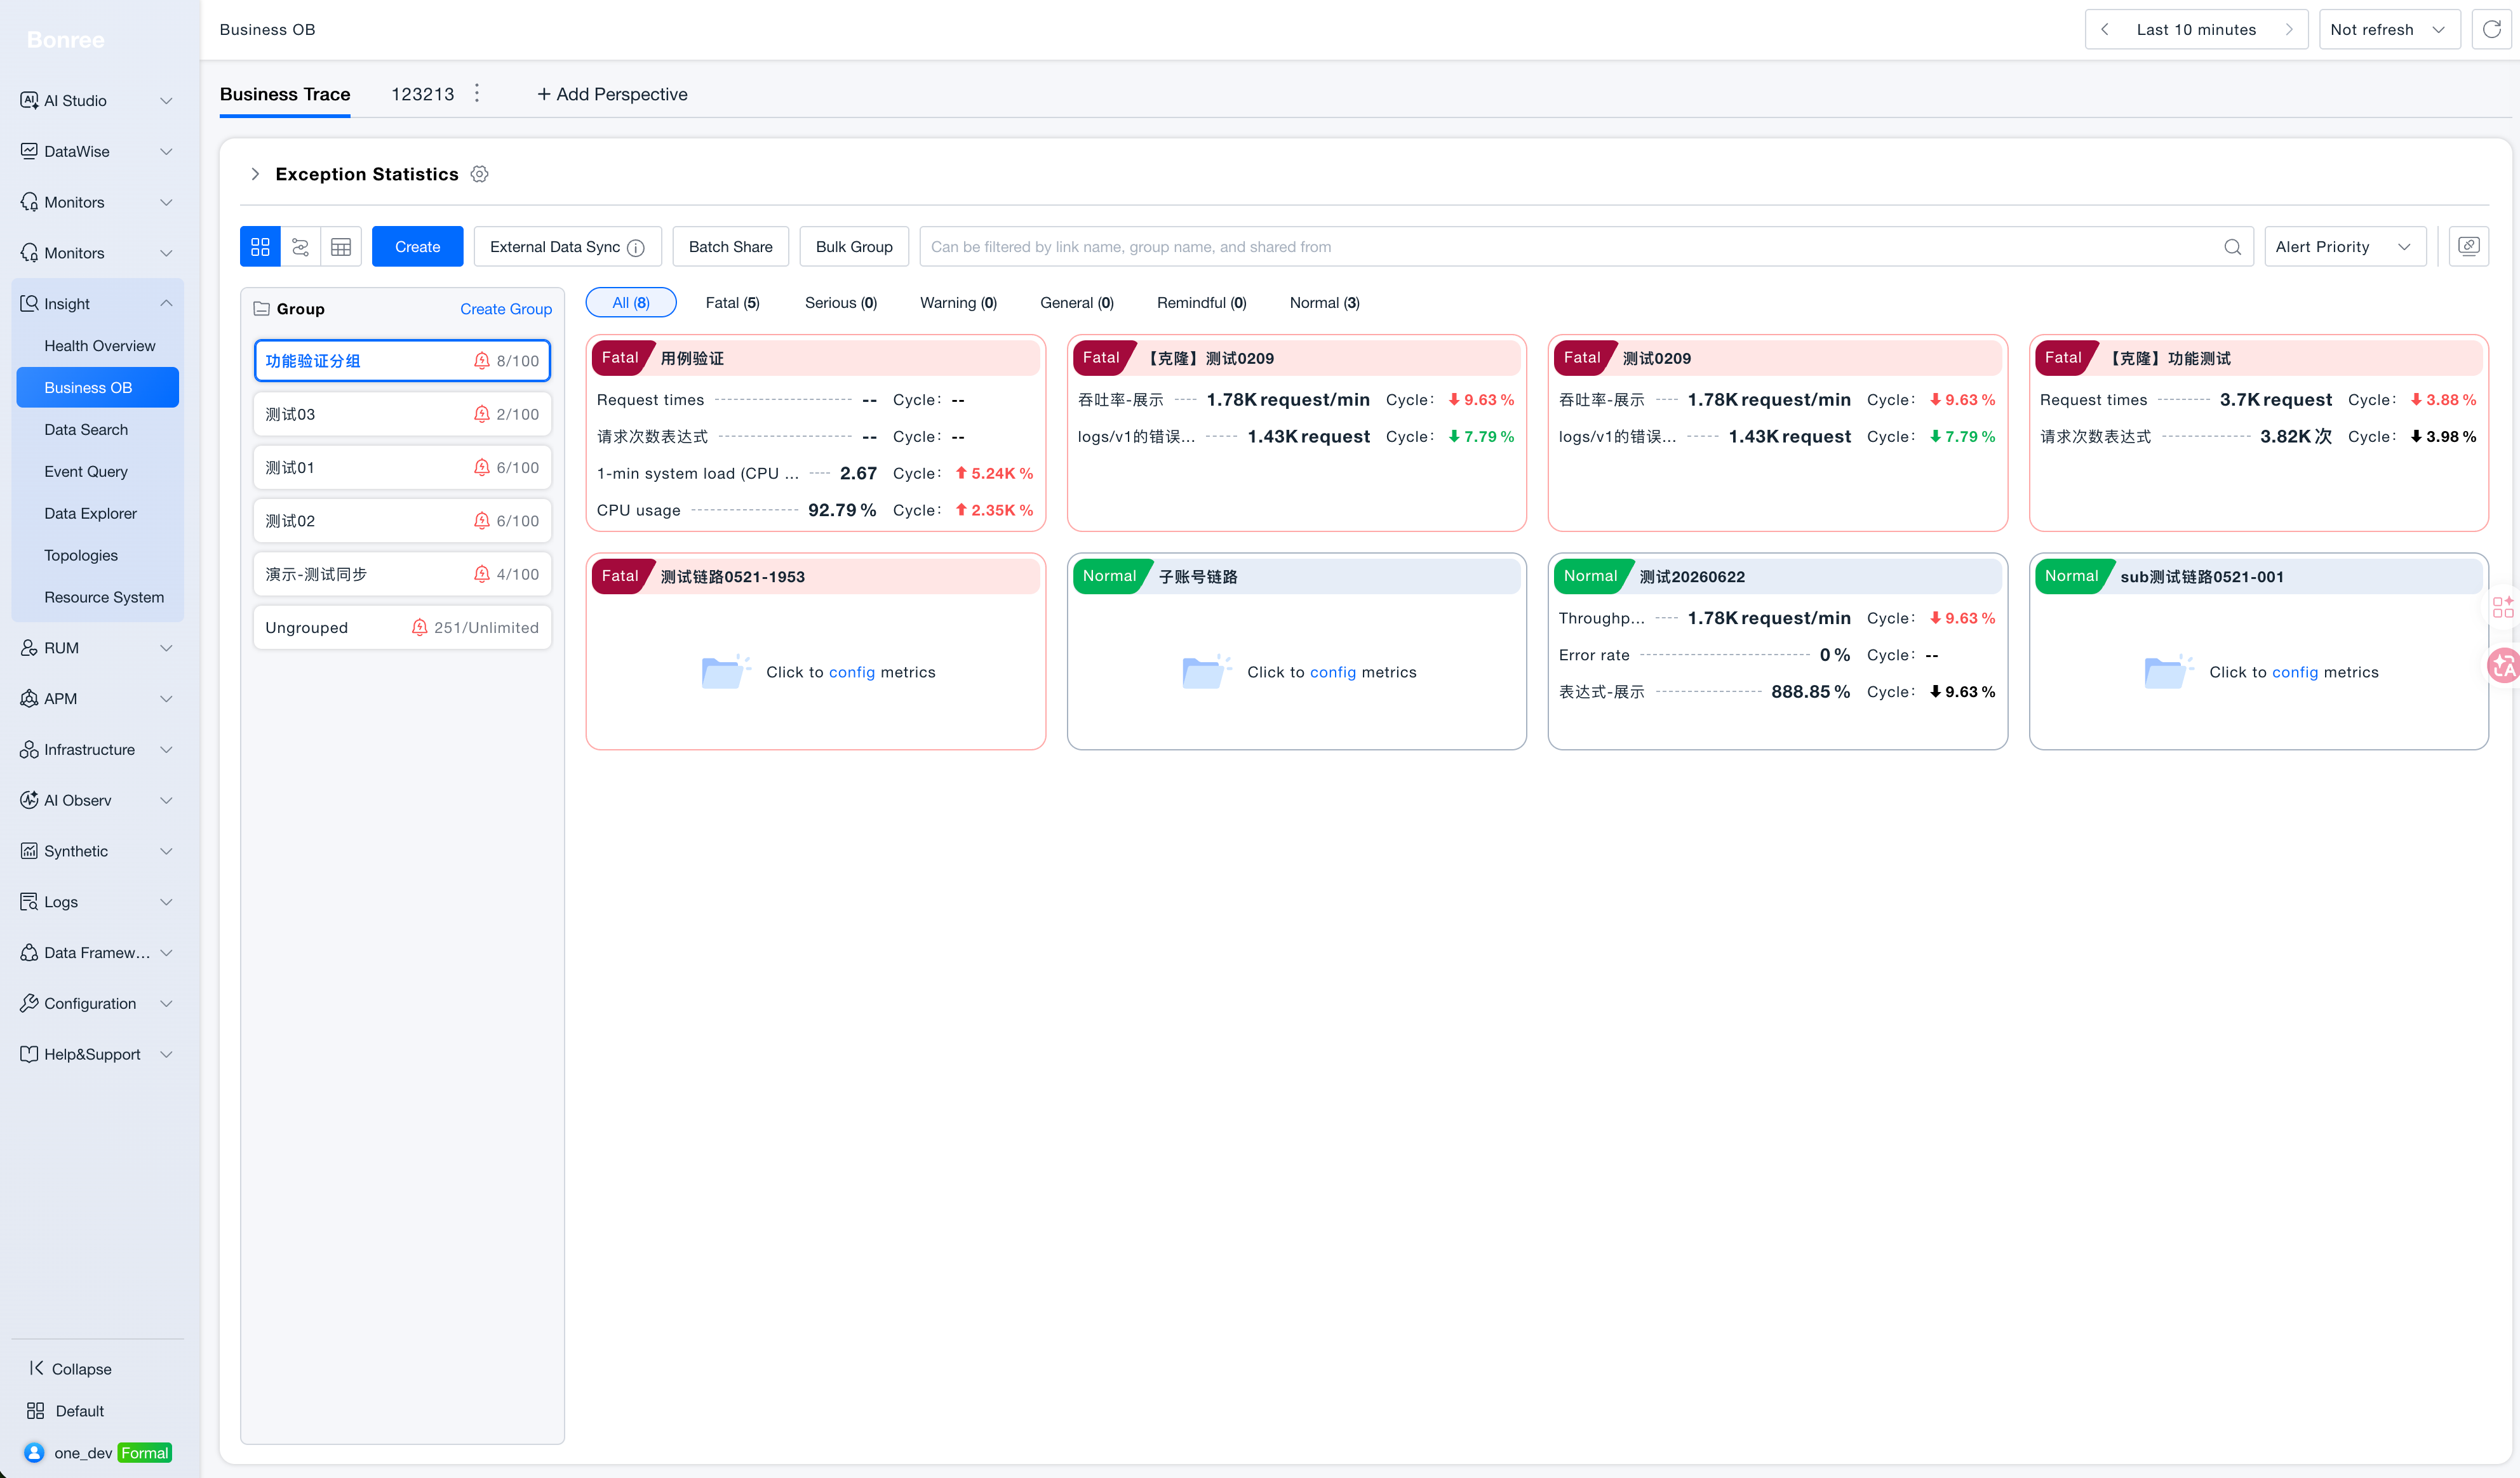
Save the trace, return to the Business Trace page, and verify that:
- The trace is available by name or group.
- Its card shows the expected nodes, health state, and key metrics.
- Nodes and edges match the real business path.
- Node details open the required metrics, alerts, logs, or traces.
If a third-party system owns the topology, use External Data Synchronization. For endpoint implementation, see the External Synchronization API Reference.
Next steps
- Apply Best Practices to improve trace scope, metrics, and routine monitoring.
- When an anomaly appears, follow the Business Trace Investigation Practice.