Operations Overview
Prerequisites
- Menu access: Access to AI Studio > Security Operations > Operations Overview is required.
- Permissions: Read access is typically sufficient.
- Data scope: Metrics aggregate per selected environment and resource domain (e.g., All or a specific domain).
Overview
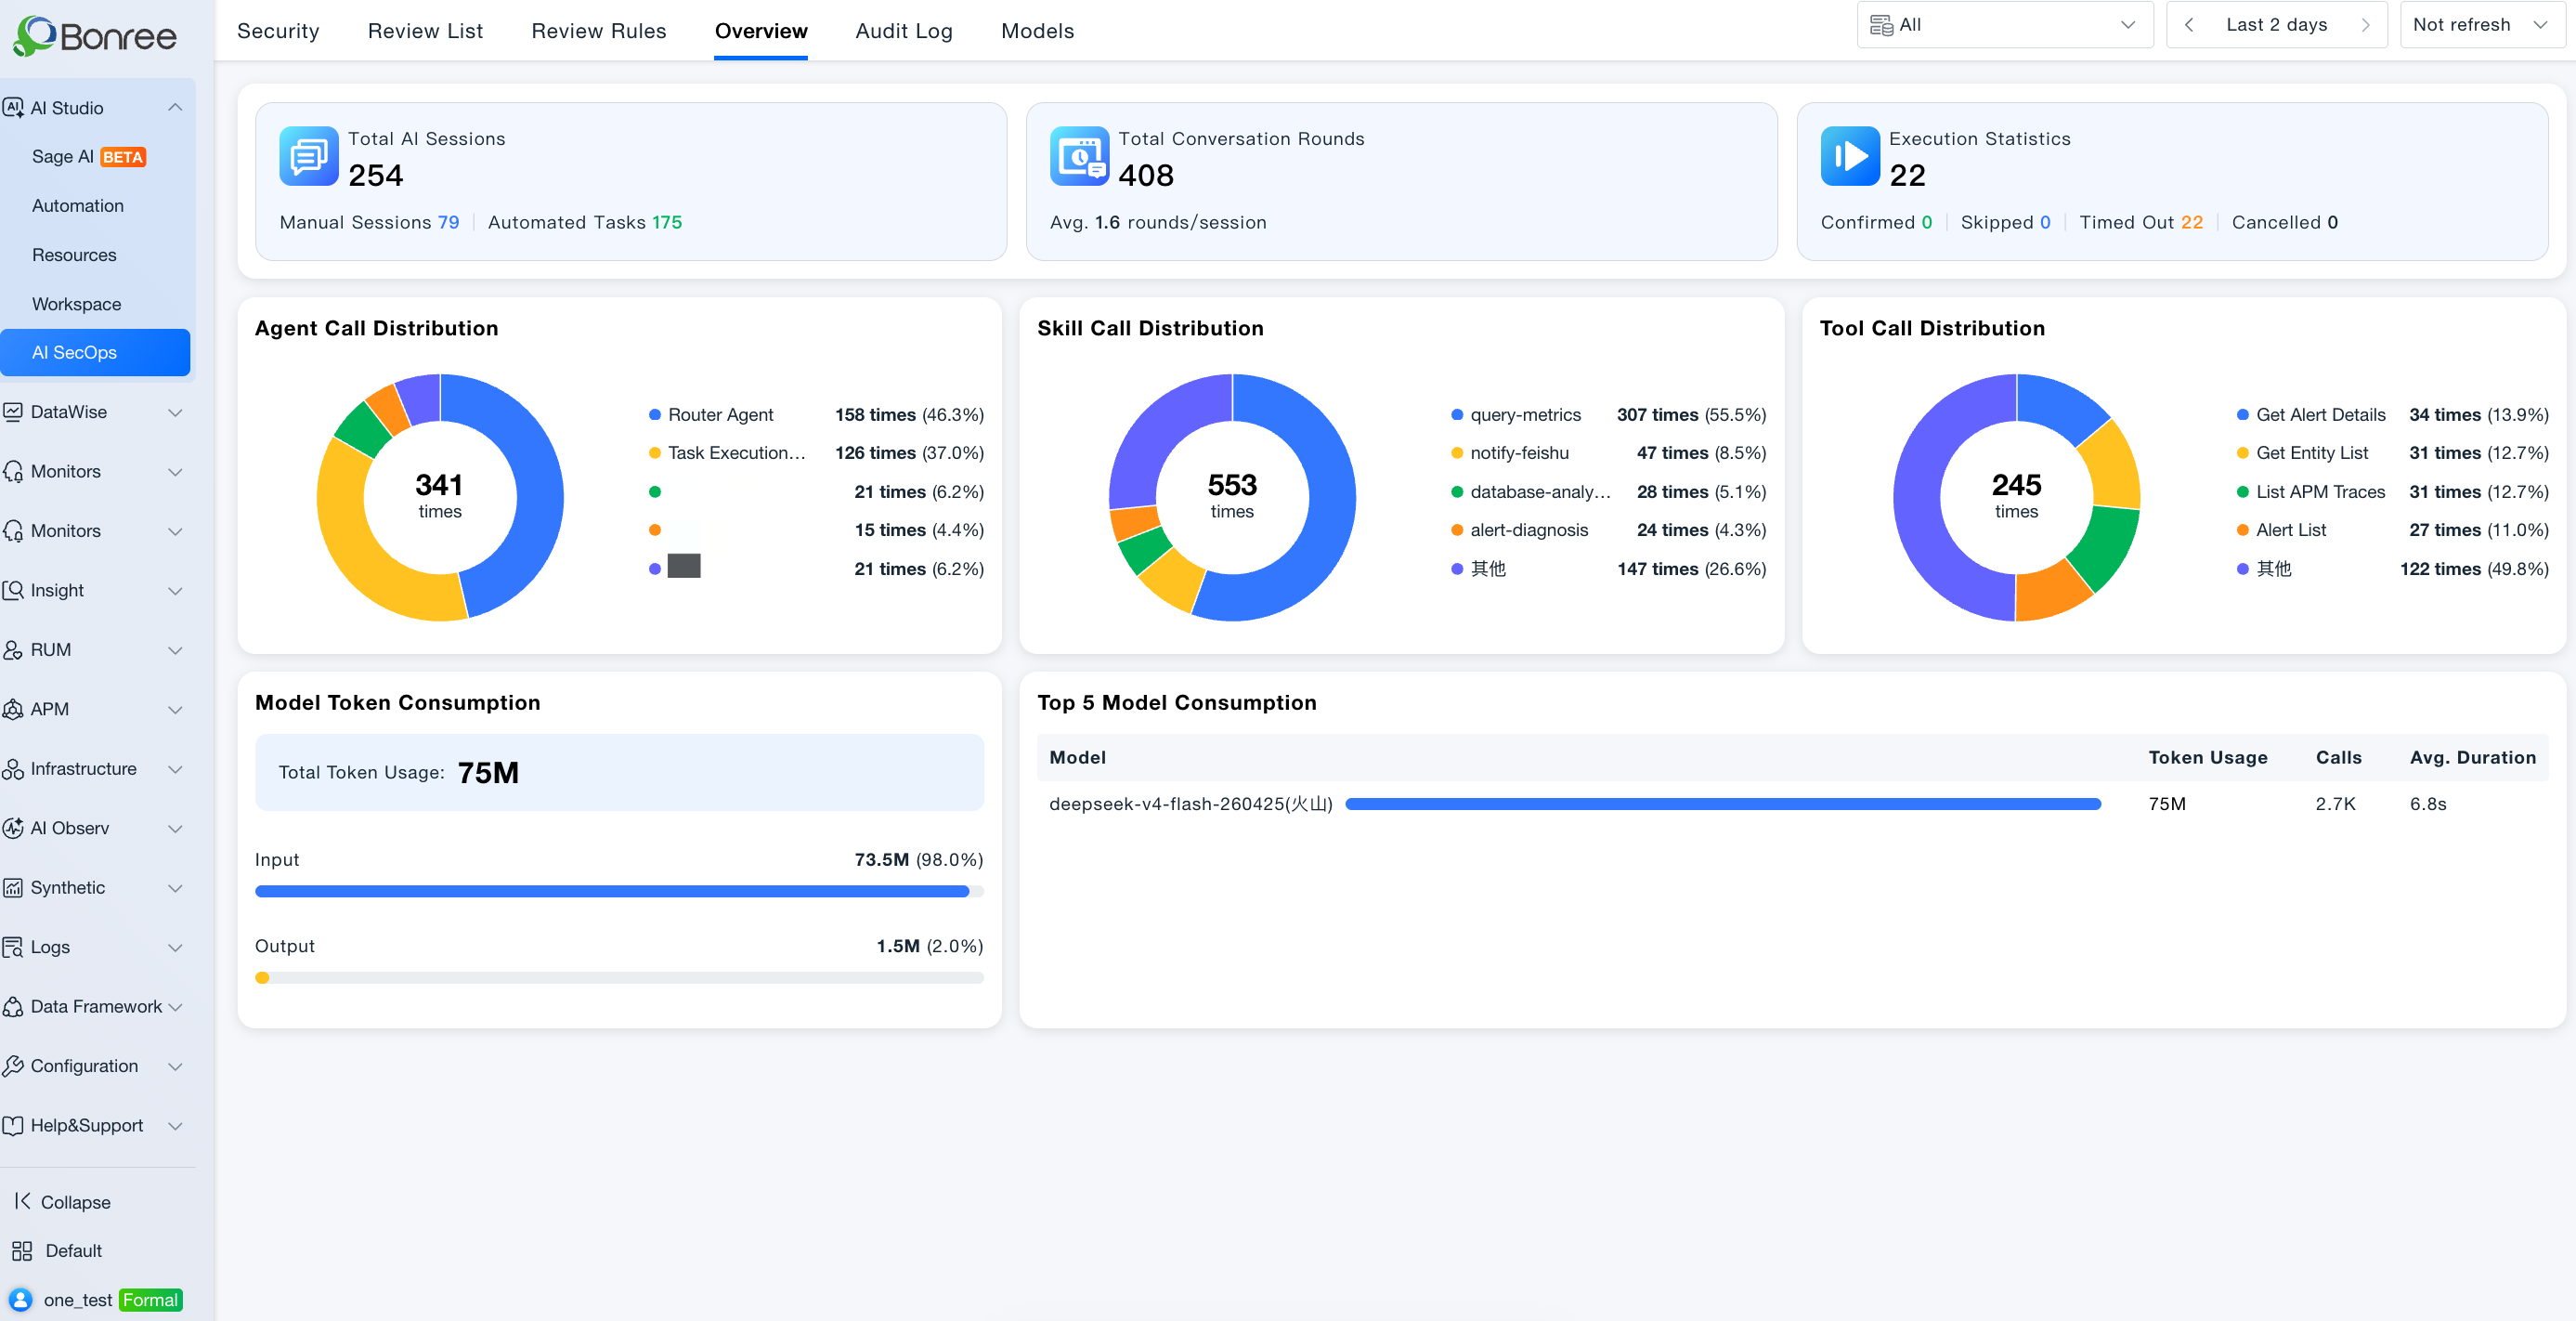
Operations Overview (Tab 4 under Security Operations) shows aggregated statistics for AI Studio sessions, invocations, and model consumption within a selected time range—helping administrators quickly see how much was used, which capabilities were invoked, and where Token was spent.
The page includes, top to bottom:
- Top filters: Resource domain scope, time range, and auto-refresh policy;
- Three summary cards: Total AI sessions, total conversation rounds, and execution statistics;
- Three distribution charts: Agent, Skill, and tool invocation distribution (donut charts with legends);
- Bottom model consumption: Total Token usage (input / output split) and Top 5 models by consumption.
Division of labor with Audit Logs: Operations Overview shows aggregated scale and distribution for the selected period; Audit Logs show who, when, and what was invoked in detail.
Top filters
| Control | Description |
|---|---|
| Resource domain / scope | e.g., All or a specific domain—defines the data scope |
| Time range | e.g., Last 10 minutes, Last 1 hour, Last 24 hours, Last 7 days, Last 30 days (per UI options); use arrows to move to adjacent windows |
| Refresh policy | e.g., Don't refresh, Refresh every 30s, Refresh every 1 min; when enabled, data updates on an interval |
All cards and charts recalculate when you change the time range or resource domain.
Glossary
These terms map directly to labels on the Operations Overview page:
| UI label | Definition |
|---|---|
| Total AI sessions | Total Sage AI sessions in the selected time range |
| Manual sessions | Sessions initiated manually in Sage AI (a breakdown under Total AI sessions) |
| Automated tasks | Sessions triggered by Automation tasks (a breakdown under Total AI sessions) |
| Total conversation rounds | Total user–AI exchange rounds across all sessions in the selected range |
| Average X rounds/session | Total conversation rounds ÷ total AI sessions—indicates average session depth |
| Execution statistics | Total disposal actions requiring user confirmation or approval in the selected range |
| Confirmed | Actions the user confirmed and executed |
| Skipped | Actions the user chose to skip |
| Timed out | Actions that timed out while waiting for confirmation |
| Canceled | Actions the user canceled |
| Agent / Skill / tool invocation distribution | Invocation count and share per Agent, Skill, or tool (donut chart) |
| Total Token consumption | Total LLM Token usage in the selected range |
| Input Token / Output Token | Split of total Token by model input vs output direction and share |
| Top 5 model consumption | Top 5 models by Token usage; shows Token volume, call count, and average duration |
UI areas
| Area | Description |
|---|---|
| Total AI sessions | Session count with Manual sessions and Automated tasks breakdown (other sources per UI); some versions support clicking source tags to filter |
| Total conversation rounds | Round count and Average X rounds/session |
| Execution statistics | Total execution actions with Confirmed / Skipped / Timed out / Canceled breakdown |
| Agent invocation distribution | Donut chart + legend: Agent name, count, percentage |
| Skill invocation distribution | Donut chart + legend: Skill name, count, percentage |
| Tool invocation distribution | Donut chart + legend: tool name, count, percentage |
| Model Token consumption | Total Token, input/output counts and proportion bars |
| Top 5 model consumption | Table columns: Model, Token consumption, Count, Average duration |
Value
- Usage visibility: Quickly grasp session volume, conversation depth, and execution action scale for the selected period.
- Capability heat map: Identify high-frequency Agents, Skills, and tools via distribution charts.
- Cost awareness: Monitor total Token and Top 5 models for anomalies or expensive models.
- Governance link: Drill into Audit Logs for details; use Review Queue to manage public capabilities.
Use Cases
Operations review
- Audience: AI Studio administrators and operations leads.
- Typical task: Summarize sessions, invocation distribution, and Token consumption over a day, week, month, or longer (by changing the time range).
- Recommended approach:
- Open Security Operations > Operations Overview; select resource domain and time range;
- Review Total AI sessions, Total conversation rounds, and the average;
- Read Agent / Skill / tool invocation distribution;
- Check Model Token consumption and Top 5.
- Outcome: Priorities for promotion, optimization, and cost control.
Measure Agent usage
- Audience: Creators, reviewers, administrators.
- Typical task: After listing an Agent, check its invocation share in a period.
- Recommended approach: Widen the time range (e.g., last 7 or 30 days); find the Agent name and count in Agent invocation distribution.
- Outcome: Decide on maintenance, documentation, or listing strategy; use Audit Logs > Call Details > Agents for detail.
Investigate Token spikes
- Audience: Platform administrators and cost owners.
- Typical task: Find why Token usage spiked in a period.
- Recommended approach: Narrow the time range → review Top 5 model consumption → use Audit Logs > Model Consumption for per-call detail if needed.
- Outcome: Identify high-consumption models and invocation patterns.
Operation overview
- AI Studio > Security Operations > Operations Overview (Tab 4 in menu order).
- Set environment, resource domain / scope, time range, and auto-refresh as needed.
- Read summary cards: sessions, rounds, execution statistics.
- Analyze invocation distribution charts and model Token consumption / Top 5.
- Switch to Audit Logs for drill-down when needed.
Notes
- Operations Overview is aggregated—no user-level detail; use Audit Logs for traceability.
- All metrics depend on the selected time range and resource domain; use consistent filters when comparing periods.
- Distribution charts only list resources invoked in the period; missing Agents/Skills/tools mean zero invocations in that window.
- Environment data is isolated.